
HRV Biofeedback Strategies (1 Hour)
Breathing assessment should always precede HRV biofeedback because dysfunctional breathing can frustrate training success. Respiration assessment can provide a roadmap for correcting breathing mechanics before initiating HRV biofeedback.
Whether a clinician trains clients at their resonance frequency (RF) or 6 breaths per minute (bpm), measuring their typical breathing rate is crucial. Their resting respiration rate can warn the clinician of the need for extensive healthy breathing training before initiating RF assessment and HRV biofeedback.
Overbreathing may be the most common breathing problem. Its expulsion of CO2 can produce a spectrum of medical and psychological symptoms (Khazan, 2020).
Assessment should begin in the waiting room to observe breathing behaviors without reactivity and continue in the clinic. Graphic © fizkes/Shutterstock.com.

BCIA Blueprint Coverage
This unit addresses HRV Biofeedback Strategies (1 Hour) and covers Breathing Assessment, Resonance Frequency Assessment, Breathing Training, and HRV Training.

This section covers Waiting Room Assessment, Clinic Assessment, Assessment Protocol, and The Nijmegen Questionnaire.
A. BREATHING ASSESSMENT
Waiting Room Assessment
The waiting room is an ideal place to observe breathing behaviors without reactivity. For example, a client's respiration rate may increase more than 5 bpm after attaching breathing sensors. Graphic © tsyhun/Shutterstock.com.

Reception staff should covertly observe respiration rate, thoracic breathing, shoulder movement, gasping, sighing, yawning, and breath-holding. Graphic © Pixel-Shot/Shutterstock.com.

Clinic Assessment
1. Watch for restrictive clothing that could interfere with abdominal expansion and the downward movement of the diaphragm muscle. Graphic © kbrowne41/Shutterstock.com.

2. Look for a posture that could also restrict the abdomen. Graphic © Marcin Balcerzak/Shutterstock.com.

Both restrictive clothing and poor ergonomics can increase respiration rate beyond a client's resonance frequency, lowering HRV.
3. Check for reverse breathing, in which the abdomen contracts during inhalation.
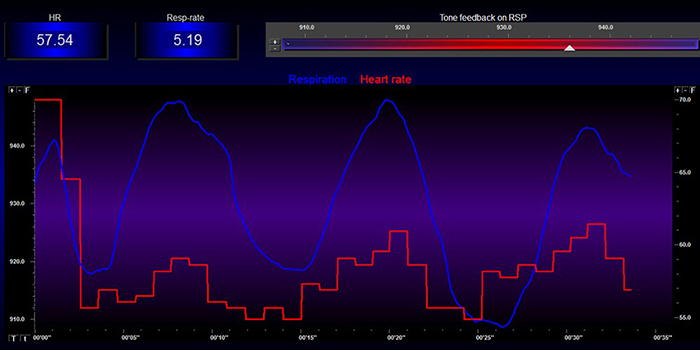
This breathing pattern can result in respiration rates that exceed the resonance frequency. In the screen capture below, the pink tracing shows instantaneous heart rate (HR), and the violet tracing shows respirometer expansion and contraction.
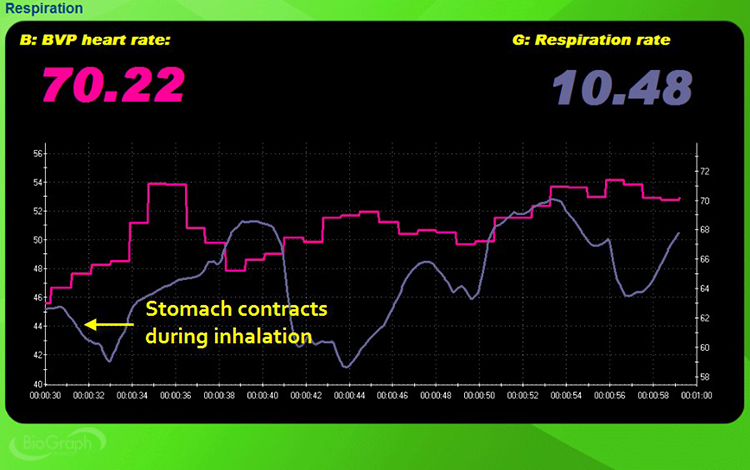
Caption: At the bottom left, the respirometer shows contraction instead of expansion during inspiration. The instantaneous heart rate and respirometer waveforms are also disorganized and choppy instead of sinusoidal like ocean waves.
4. Check for clavicular breathing, where the shoulders rise and fall during breathing.
Clavicular breathing often involves rapid breathing to compensate for shallow inhalation volumes. In the screen capture below, the pink tracing shows accessory muscle (e.g., trapezius and scalene) SEMG, and the violet tracing shows respirometer expansion and contraction.
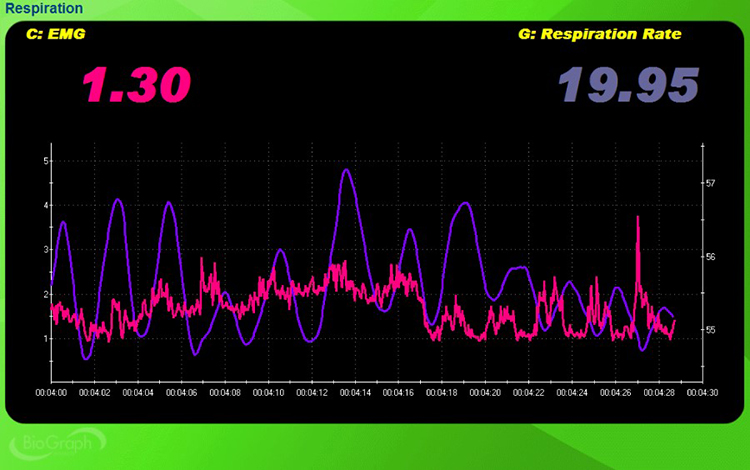
Caption: The mean respiration rate is 19.95 bpm, almost three times the client's likely resonance frequency. See the elevated SEMG reading and reduced inspirometer expansion at the far right.
5. Check whether breathing is primarily thoracic or abdominal, using covert observation and a respirometer.
Thoracic breathing can speed respiration above your client's resonance frequency. In the screen capture below, the pink tracing shows instantaneous HR, and the violet tracing shows respirometer expansion and contraction.
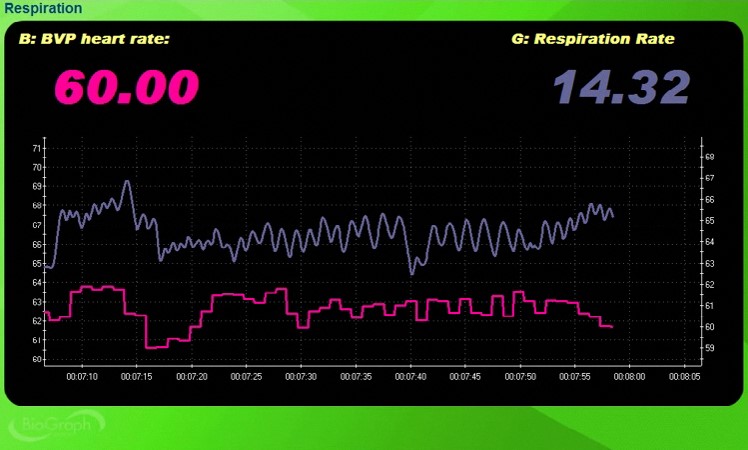
Caption: The mean respiration rate is 14.32, well above the client's likely resonance frequency, and the two waveforms are shallow and disorganized.
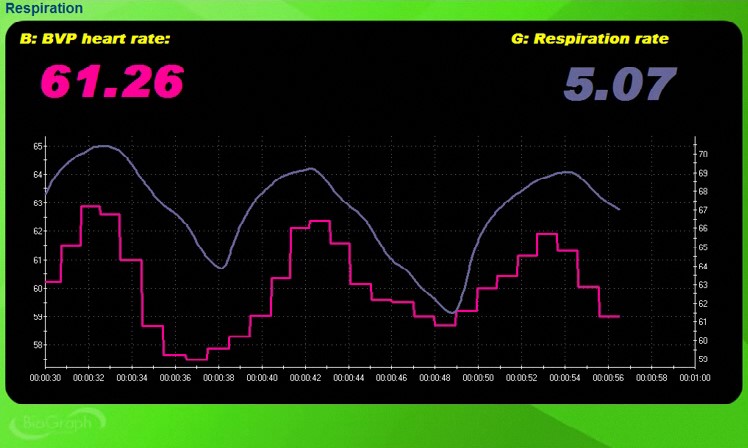
Compare this screen capture with the one below, which illustrates abdominal breathing. The mean respiration rate is 5.07. Both waveforms are sinusoidal with high amplitude and in-phase (their peaks and valleys coincide).
6. Check for apnea, which is the suspension of breathing.
Apnea disrupts abdominal breathing and can raise blood pressure. In the screen capture below, the pink tracing shows instantaneous HR, and the violet tracing shows respirometer expansion and contraction.
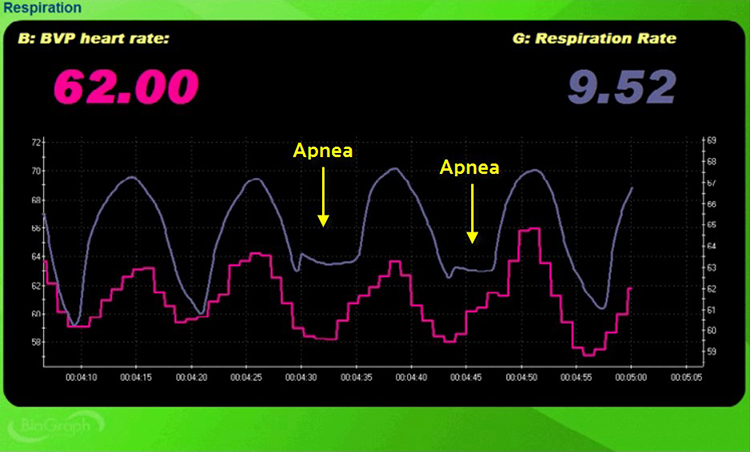
Caption: Toward the middle of the recording, the bottom of the inspirometer wave is flattened, denoting breath-holding.
7. Check respiration rate and amplitude (amount of respirometer movement). Thoracic breathing at rates at or above 16 bpm may be associated with overbreathing or hyperventilation syndrome (HVS). Neblett (2013) cautions that chronic pain patients may breathe faster than 20 bpm. The display below shows the shallow, rapid breathing that can characterize overbreathing.
8. Check breathing effort by monitoring the abdominal tracing for loss of a smooth sinusoidal pattern.
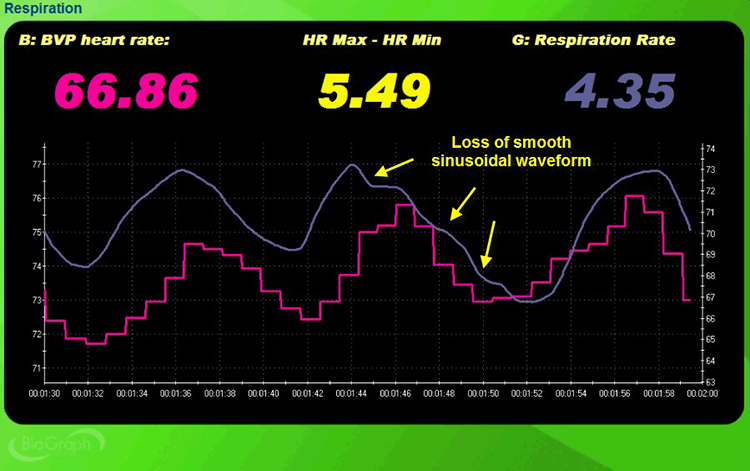
Caption: There are three inflection points in the screen capture below (marked by yellow arrows) where the second breathing cycle is distorted by effort.
9. Monitor accessory and frontal SEMG as a second index of breathing effort.
In the screen capture below, accessory SEMG is shown in pink and respirometer movement is shown in pink.
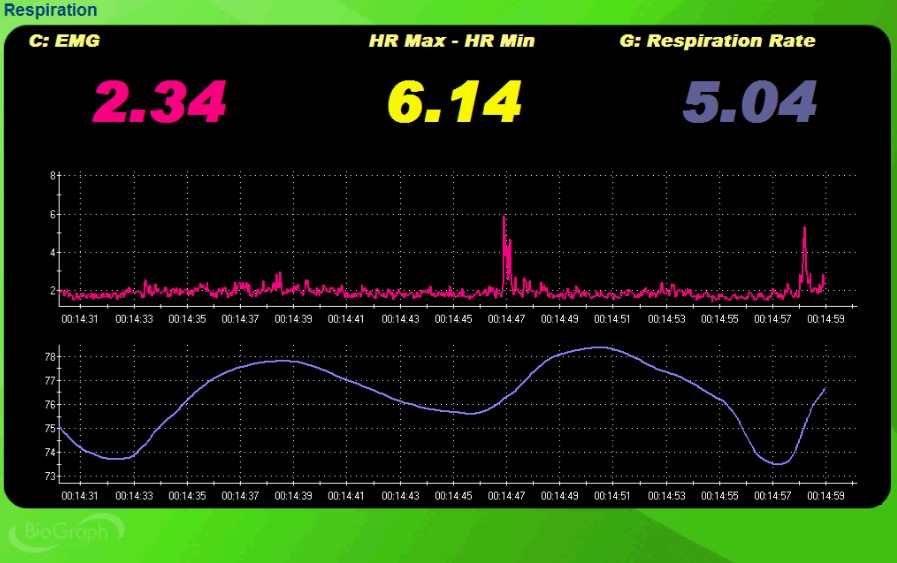
Caption: See the two SEMG spikes over 5 microvolts (around 00:14:47 and 00:14:58) that coincide with the last two inhalations.
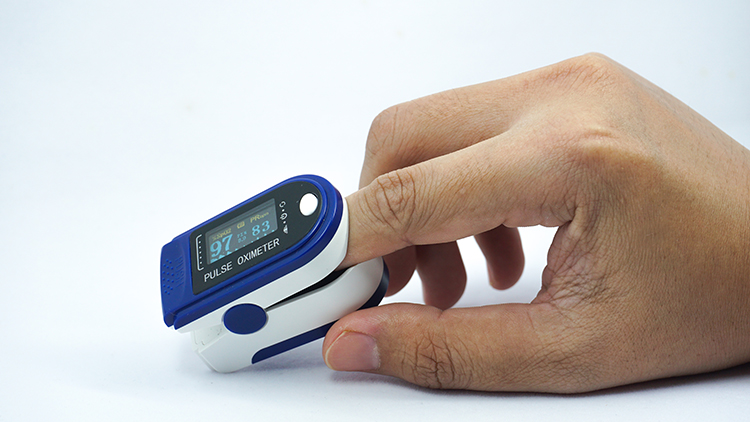
10. Check oxygen saturation (PO2) using a pulse oximeter. A range of 95%-98% is ideal. Hyperventilation may increase it to 100% (Gilbert, 2019). Graphic © TomoTaro/Shutterstock.com.
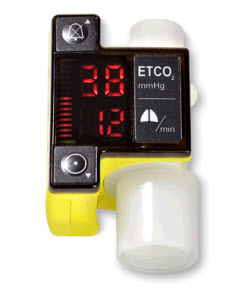
11. Check end-tidal CO2 using a capnometer. A value of 36 torr (5%) is normal, while values below 33 torr are seen in hyperventilation syndrome (HVS) and overbreathing. A healthy range is 35-45 torr. Values below 25 mmHg signal severe overbreathing, 25-30 mmHg, moderate-to-severe overbreathing, and 30-35 mmHg, mild-to-moderate overbreathing (Khazan, 2020).
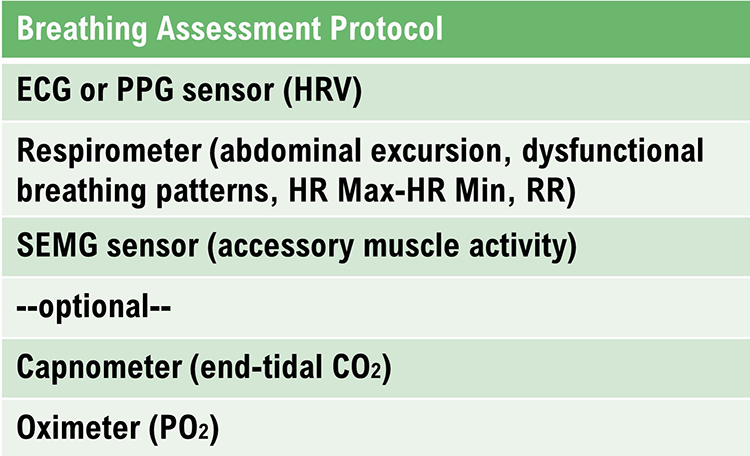
Breathing Assessment Protocol
Breathing assessment requires an ECG or PPG sensor to monitor HRV, a respirometer to measure abdominal excursion and respiration rate, and a SEMG sensor to evaluate accessory muscle activity. A capnometer to measure end-tidal CO2 and an oximeter to measure PO2 are optional.
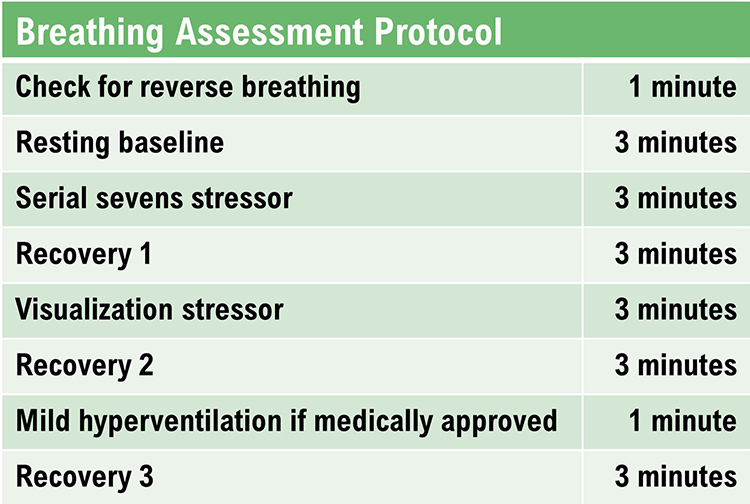
You could structure a breathing evaluation protocol as follows:
1. Check for reverse breathing: "Take a normal breath, hold it, and then exhale." Wait 30 seconds. "Take another normal breath and then exhale" (1 minute, no feedback). Watch the screen for evidence of reverse breathing and accessory muscle overuse.
In the screen capture below, the pink tracing shows instantaneous HR, and the violet tracing shows respirometer contraction and expansion.
Caption: There is evidence of reverse breathing since the respirometer tracing falls during inspiration and rises during expiration.
2. Resting baseline: "Breathe normally for the next 3 minutes" (3 minutes, with no feedback). Watch the display for abdominal excursion, smooth respiration, breathing effort, respiration rate, synchrony between the respiration and HR tracings, and apnea. Watch your client for gasping, shoulder movement, sighing, and yawning.
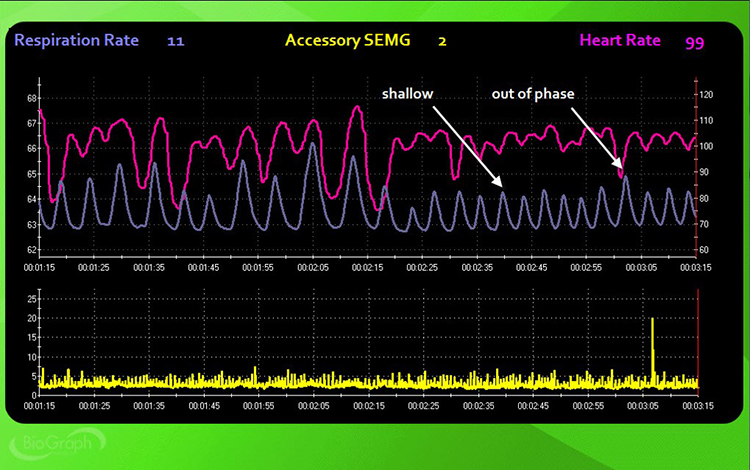
Caption: By the 00:2:30 mark, abdominal excursion becomes shallow, and respiration and HR move out of phase.
3. Serial-sevens stressor: "Mentally count backward from 1000 by 7s until I stop you and ask for the number you are on" (3 minutes, no feedback). Watch the display for abdominal excursion, smooth respiration, breathing effort, respiration rate, synchrony between the respiration and HR tracings, and apnea. Watch your client for gasping, shoulder movement, sighing, and yawning.
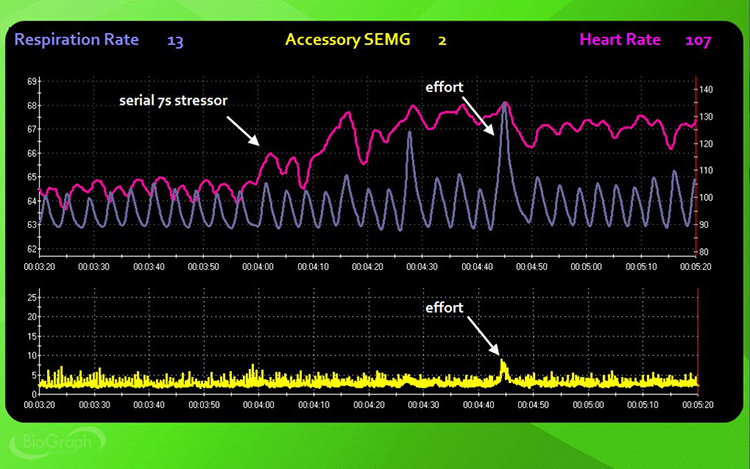
Caption: HR starts to rise with the onset of the serial-sevens stressor around 00:4:05 and exceeds 13 bpm at several points during this trial. The mean respiration rate is around 13 bpm compared with 11 bpm during the resting baseline. Around the 00:4:45 mark, effort is indicated by the large respirometer excursion and an 8-microvolt spike in accessory SEMG activity.
4. Recovery 1: "Stop subtracting and breathe normally for the next 3 minutes" (3 minutes, no feedback). Watch the display for abdominal excursion, smooth respiration, breathing effort, respiration rate, synchrony between the respiration and HR tracings, and apnea. Watch your client for gasping, shoulder movement, sighing, and yawning.
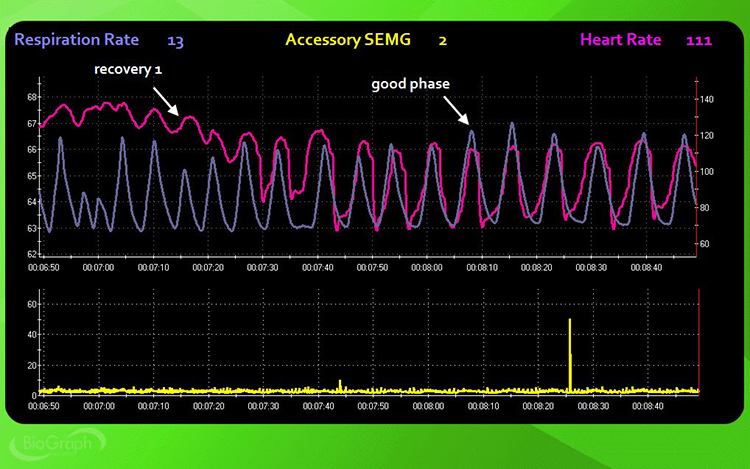
Caption: HR starts to slow soon after the recovery instructions around mark 00:07:15. By mark 00:07:30, both respirometer and HR tracings become sinusoidal and synchronous. Accessory muscle activity is unremarkable, except for a single spike around mark 00:08:26.
5. Visualize a mildly upsetting experience: "Use all of your senses to recreate a mildly upsetting experience vividly. Raise a finger when you are re-experiencing the event and continue for the next 3 minutes (3 minutes, no feedback). Watch the display for abdominal excursion, smooth respiration, breathing effort, respiration rate, synchrony between the respiration and HR tracings, and apnea. Watch your client for gasping, shoulder movement, sighing, and yawning.
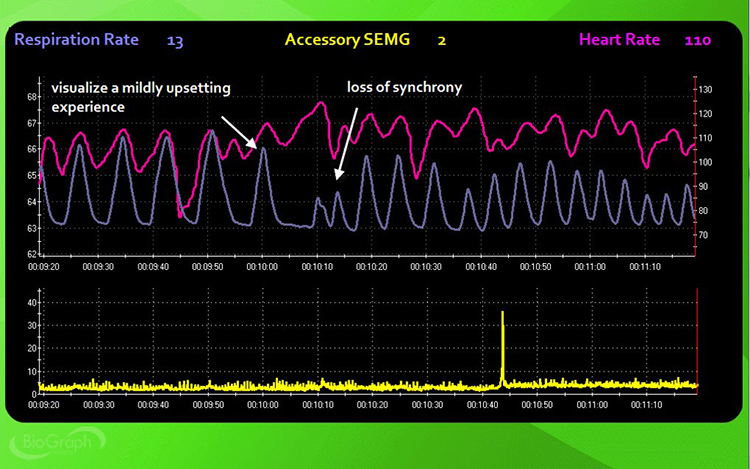
Caption: HR starts to rise with the onset of the visualization stressor around mark 00:10:00, respiration amplitude decreases, and respirometer and HR synchrony disappears. There is a single incidence of breath-holding when the subject visualizes the event.
6. Recovery 2: "Stop your visualization and breathe normally for the next 3 minutes" (3 minutes, no feedback). Watch the display for abdominal excursion, smooth respiration, breathing effort, respiration rate, synchrony between the respiration and HR tracings, and apnea. Watch your client for gasping, shoulder movement, sighing, and yawning.
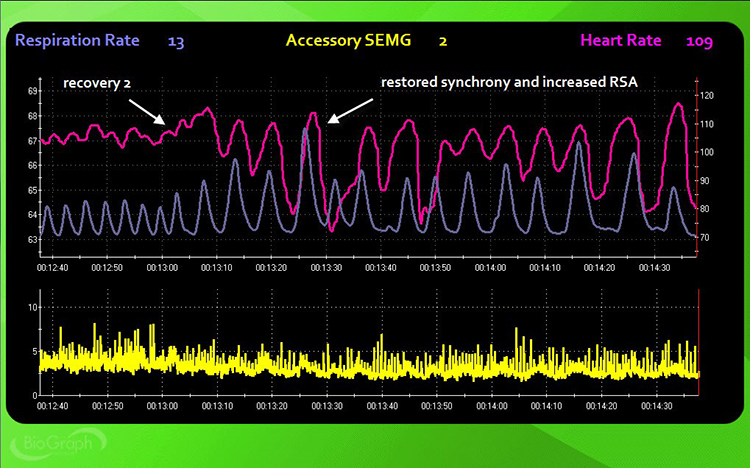
Caption: Respiration amplitude and RSA increase, and synchrony returns about 30 seconds into the recovery trial. Accessory muscle activity also slightly decreases.
7. Hyperventilation challenge: "Breathe rapidly for the minute or until you are uncomfortable" (1 minute, no feedback). Watch your client for signs of distress. Stop immediately if your client experiences dizziness, pain, or panic. Watch for respiration rate, end-tidal CO2, and oxygen saturation. Common symptoms of hyperventilation include feelings of anxiety, breathlessness, dizziness, lightheadedness, rapid heartbeat, and tingling (Lehrer et al., 2013).
8. Recovery 3: "Stop breathing rapidly and breathe normally for the next 3 minutes" (3 minutes, no feedback). Watch for respiration rate, end-tidal CO2, and oxygen saturation.
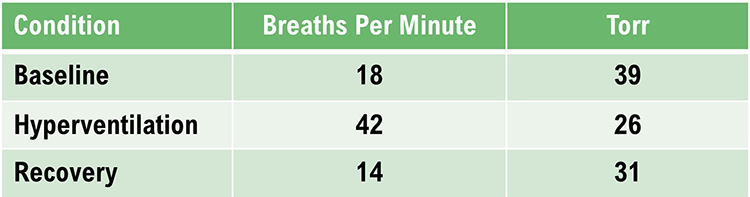
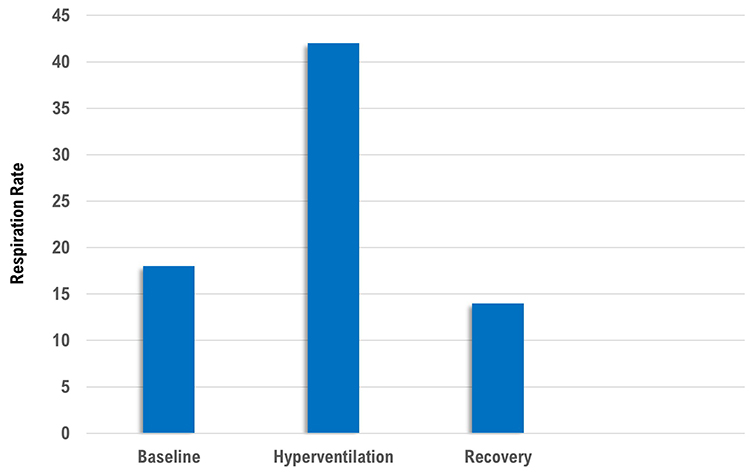
Don Moss (2013) generously provided respiration rate and end-tidal CO2 data from a 53-year-old married woman diagnosed with agoraphobia and panic disorder. The hyperventilation challenge was crucial to this patient's assessment and was conducted by an experienced licensed clinical psychologist.
 |
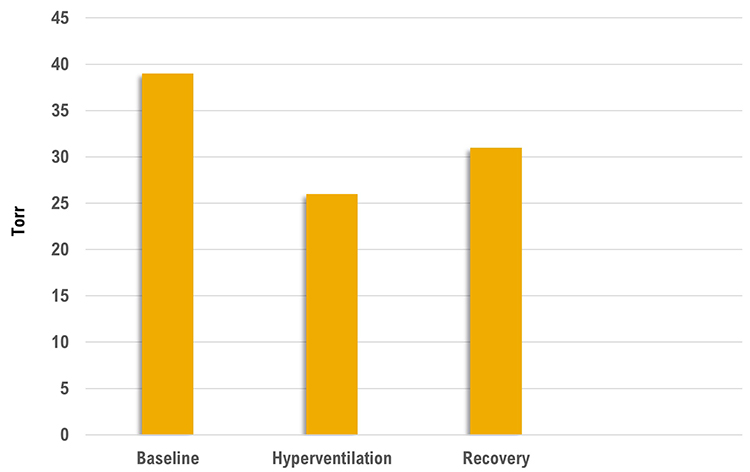 |
Despite breathing at 18 bpm during baseline, her end-tidal CO2 was normal. The hyperventilation challenge increased her respiration rate to 42 bpm and resulted in hypocapnia with an end-tidal CO2 of 26. During the recovery trial, her respiration rate decreased below baseline, but her end-tidal CO2 remained below the normal cutoff of 35 torr.
Summary of the Breathing Assessment Protocol
A mild hyperventilation challenge is contraindicated for clients diagnosed with epilepsy, heart disease, kidney disease, panic disorder, and PTSD.
Clinicians may add the Stroop test followed by a recovery period.
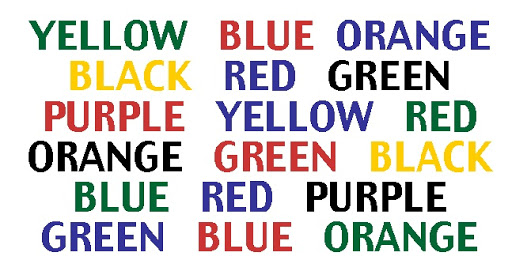
Inna Khazan (2019) provided an example of a breathing assessment using the Stroop test. The client was a 30-year-old woman who was divorcing her alcoholic husband. She presented with anxiety and diverse symptoms (difficulty focusing, GI distress, headaches, lightheadedness, racing heart, and shortness of breath).
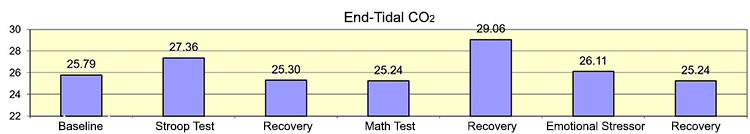
Caption: Note that end-tidal CO2 remained below the normal (35-45 mmHg) range throughout the assessment. Although the client recovered from the math stressor, end-tidal CO2 further declined following the emotional stressor.
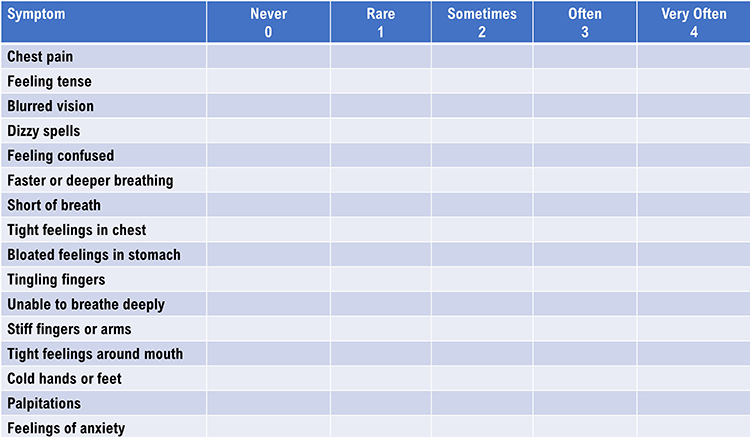
Nijmegen Questionnaire
There are approximately 100,000 miles of blood vessels in the brain, with a flow rate of about 750 milliliters per minute in adults.

The graphic below shows reduced cerebral blood perfusion (depicted by dark colors) during overbreathing, producing the Nijmegen questionnaire's symptoms.
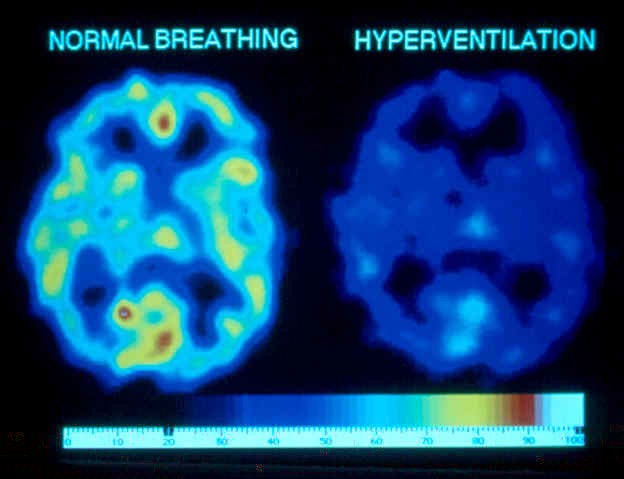
A score of 23 out of 64 on the Nijmegen questionnaire suggests further screening for hyperventilation syndrome.
Glossary
accessory muscles: the sternocleidomastoid, pectoralis minor, scalene, and trapezius muscles, which are used during forceful breathing, as well as during clavicular and thoracic breathing.
apnea: breath suspension.
behavioral breathlessness syndrome: the perspective that hyperventilation is the consequence and not the cause of the disorder. The traditional model that hyperventilation results in reduced arterial CO2 levels has been challenged by the finding that many HVS patients have normal arterial CO2 levels during attacks.
capnometer: an instrument that monitors the carbon dioxide (CO2) concentration in an air sample (end-tidal CO2) by measuring the absorption of infrared light.
clavicular breathing: a breathing pattern that primarily relies on the external intercostals and the accessory muscles to inflate the lungs, resulting in a more rapid respiration rate, excessive energy consumption, and incomplete ventilation of the lungs.
diaphragm: the dome-shaped muscle whose contraction enlarges the vertical diameter of the chest cavity and accounts for about 75% of air movement into the lungs during relaxed breathing.
end-tidal CO2: the percentage of CO2 in exhaled air at the end of exhalation.
hyperventilation syndrome (HVS): a respiratory disorder that has been increasingly reconceptualized as a behavioral breathlessness syndrome in which hyperventilation is the consequence and not the cause of the disorder. The traditional model that hyperventilation results in reduced arterial CO2 levels has been challenged by the finding that many HVS patients have normal arterial CO2 levels during attacks.
overbreathing: a mismatch between breathing rate and depth due to excessive breathing effort and subtle breathing behaviors like sighs and yawns can reduce arterial CO2.
pulse oximeter: a device that measures dissolved oxygen in the bloodstream using a photoplethysmograph sensor placed against a finger or earlobe.
respiratory amplitude: the excursion of an abdominal strain gauge.
resonance frequency: the breathing rate that maximizes the most time-domain measurements of HRV.
respiratory sinus arrhythmia (RSA): HR acceleration during inspiration and deceleration during expiration.
respirometer: a sensor that changes resistance to a current as it expands and contracts during the respiratory cycle.
reverse breathing: the abdomen expands during exhalation and contracts during inhalation, often resulting in incomplete ventilation of the lungs.
thoracic breathing: a breathing pattern that primarily relies on the external intercostals to inflate the lungs, resulting in a more rapid respiration rate, excessive energy consumption, and incomplete ventilation of the lungs.
torr: a unit of atmospheric pressure, named after Torricelli, which equals 1 millimeter of mercury (mmHg) and is used to measure end-tidal CO2.
trapezius-scalene placement: the active SEMG electrodes are located on the upper trapezius and scalene muscles to measure respiratory effort.
REVIEW FLASHCARDS ON QUIZLET
Click on the Quizlet logo to review our chapter flashcards.

Assignment
Now that you have completed this module, how might you redesign your breathing assessment protocol? Which measurements might you add?
References
Fried, R. (1987). The hyperventilation syndrome: Research and clinical treatment. John Hopkins University Press.
Gevirtz, R. N. (2005). Heart rate variability biofeedback in clinical practice. AAPB Fall workshop.
Gilbert, C. (2012). Pulse oximetry and breathing training. Biofeedback, 40(4), 137-141. doi:http://dx.doi.org/10.5298/1081-5937-40.4.04
Gilbert, C. (2019). A guide to monitoring respiration. Biofeedback, 47(1), 6-11. https://doi.org/10.5298/1081-5937-47.1.02
Kern, B. (2014). Hyperventilation syndrome. eMedicine.
Khazan, I., & Shaffer, F. (2019). Practical strategies for teaching your clients to breathe. Association for Applied Psychophysiology and Biofeedback 50th Annual Meeting, Denver, CO.
Khazan, I. (2020). The myths and misconceptions of heart rate variability. Association for Applied Psychophysiology and Biofeedback Virtual Conference.
Khazan, I. Z. (2013). The clinical handbook of biofeedback: A step-by-step guide for training and practice with mindfulness. John Wiley & Sons, Ltd.
Lehrer, P., Vaschillo, B., Zucker, T., Graves, J., Katsamanis, M., Aviles, M., & Wamboldt, F. (2013). Protocol for heart rate variability biofeedback training. Biofeedback, 41(3), 98-109. https://doi.org/10.5298/1081-5937-41.3.08
Neblett, R. (2013). Personal communication about breathing patterns in chronic pain patients.
Peper, E., Gibney, K. H., Tylova, H., Harvey, R., & Combatalade, D. (2008). Biofeedback mastery: An experiential teaching and self-training manual. Wheat Ridge, CO: AAPB.
Shaffer, F., Bergman, S., & Dougherty, J. (1998). End-tidal CO2 is the best indicator of breathing effort [Abstract]. Applied Psychophysiology and Biofeedback, 23(2).
Shaffer, F., Bergman, S., & Henson, M. (1998). Description of the Truman breathing assessment protocol [Abstract]. Applied Psychophysiology and Biofeedback, 23(2).
Shaffer, F., Bergman, S., & White, K. (1997). Indicators of diaphragmatic breathing effort [Abstract]. Applied Psychophysiology and Biofeedback, 22(2), 145.
Shaffer, F., Mayhew, J., Bergman, S., Dougherty, J., & Irwin, D. (1999). Designer jeans increase breathing effort [Abstract]. Applied Psychophysiology and Biofeedback, 24(2), 124-125.
Shaffer, F., & Moss, D. (2006). Biofeedback. In Y. Chun-Su, E. J. Bieber, & B. Bauer (Eds.). Textbook of complementary and alternative medicine (2nd ed.). Informa Healthcare.
B. RESONANCE FREQUENCY ASSESSMENT
The resonance frequency is a fixed characteristic of an adult's cardiovascular system that reflects the blood volume in the vascular tree (Vaschillo et al., 2002, 2006).
Graphic © Design_Cells/Shutterstock.com.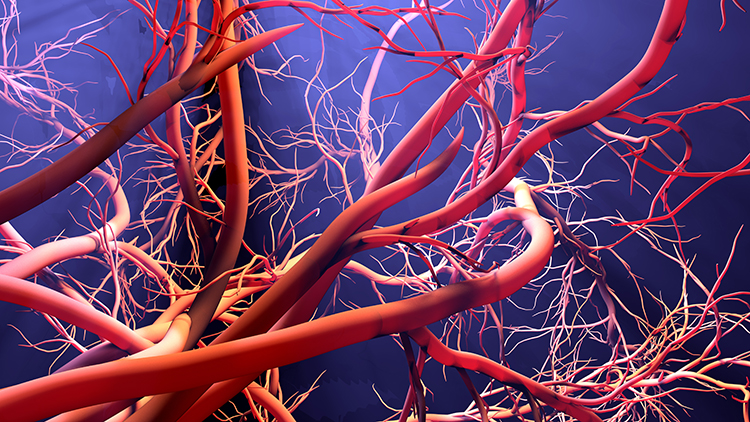
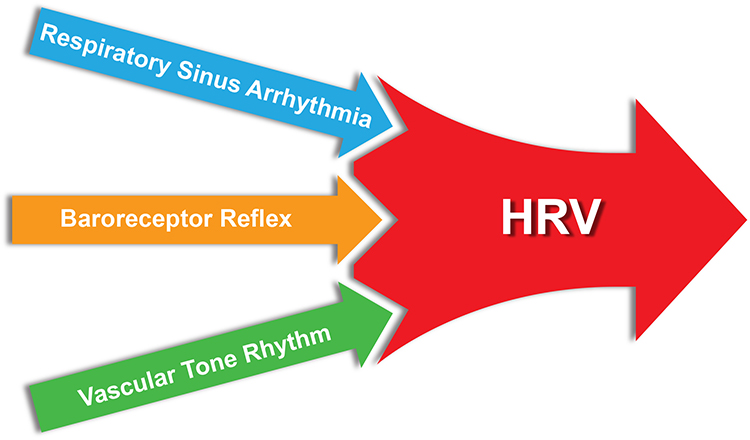
Practitioners use resonance frequency (RF) and slow-paced breathing protocols to teach clients to increase heart rate variability (HRV). Both strategies increase respiratory sinus arrhythmia (RSA), which stimulates the baroreceptor reflex and vascular tone rhythm to increase HRV. Graphic © BioSource Software LLC.
For the cardiovascular system, the resonance frequency (RF) is the rate at which it can be stimulated to produce the greatest RSA amplitudes, HRV, and baroreflex gain (Lehrer, Vaschillo, & Vaschillo, 2000). Baroreflex gain is heart rate (HR) change per 1 mmHg change in blood pressure (BP; Lehrer & Gevirtz, 2014).
The mechanisms underlying this amplification process are complex:
The mechanism for this effect lies in a confluence of processes: (1) phase relationships between heart rate oscillations and breathing at specific frequencies, (2) phase relationships between heart rate oscillations and breathing at specific frequencies, (3) activity of the baroreflex, and (4) resonance characteristics of the cardiovascular system (Lehrer & Gevirtz, 2014, p. 1).The graphic below, adapted from Gevirtz et al. (2016), illustrates a 4- to 10-fold RSA increase from breathing at typical rates to RF breathing (Vaschillo et al., 2002; Lehrer et al., 2020b).
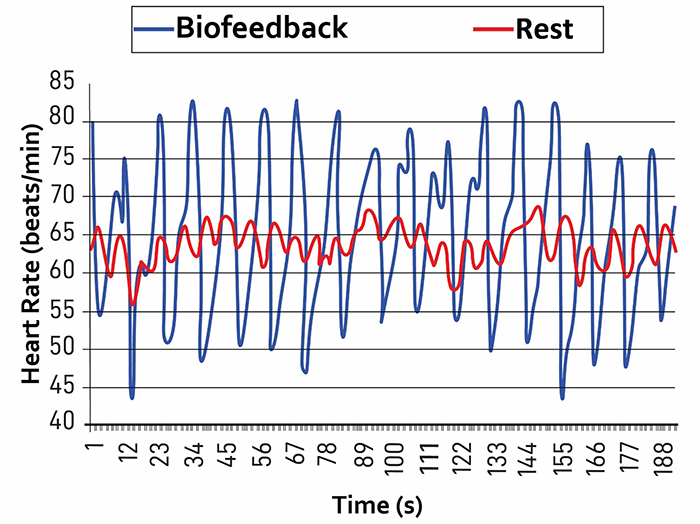
Caption: The red waveform shows HR oscillations while resting without breathing instructions or feedback. The blue waveform shows HR oscillations with HRV biofeedback and breathing from 4.5-6.5 bpm.
RF assessment aims to identify the approximate stimulation rate that produces the strongest resonance effects (RSA).
The RF model assumes that the RF ranges between 4.5 and 6.5 times/minute for adults and 6.5-9.5 times/minute for children and that training near the RF will produce the greatest RSA and HRV (Lehrer et al., 2013; Lehrer & Gevirtz, 2014).Appreciation
Lehrer et al. (2013) developed the original RF measurement protocol. We recommend their excellent article on HRV biofeedback training in Biofeedback.
We also enthusiastically recommend Lehrer and Gevirtz's Frontiers HRV biofeedback overview.
Didier Combatalade, Director of Clinical Interface at Thought Technology Ltd., provided invaluable technical support in measuring the phase relationship between respirometer and heart rate signals using BioGraph Infiniti software.

Christopher Zerr, Washington University Cognitive Neuroscience postdoctoral fellow, provided technical support and supervised data collection to illustrate this protocol.

This section covers the Resonance Frequency Measurement Protocols, Fine-Tuning the Resonance Frequency, An Alternative Method to Find the Resonance Frequency, and Unanswered Questions.
Resonance Frequency Measurement Protocols
Start with Breathing Assessment
RF measurement protocols require that clients breathe continuously and smoothly at slower-than-typical rates. Breathing assessment can identify rapid breathing and dysfunctional behaviors that could interfere with RF determination. Asthma, Generalized Anxiety Disorder, low back pain, and dysfunctional breathing behaviors like overbreathing may be associated with rapid breathing. Postpone RF assessment for adults until you successfully train them to breathe effortlessly (Peper et al., 2008) between 4.5 and 6.5 bpm.Resonance Frequency Assessment Concerns and Contraindications
Some clients may find slow-paced breathing difficult. They may overbreathe and expel excessive CO2. If they report symptoms of feeling faint or rapid heartbeats, encourage them to take shallower and smoother breaths (Lehrer et al., 2013).Resonance frequency assessment is contraindicated for clients whose sinus rhythm is driven by a pacemaker because this device externally regulates HRV. Do not assess clients whose overbreathing compensates for increased acidity in the blood due to conditions like kidney disease. Slow-paced breathing would increase CO2 levels in the blood and dangerously increase acidosis (Khazan, 2013).
Sensor Channels and Parameters Monitored
Resonance frequency measurement requires the display of instantaneous HR and respiration in real-time.ECG or PPG Methods
A clinician monitors HR using an electrocardiograph (ECG) or a photoplethysmograph (PPG). Both ECG and PPG sensors obtain similar interbeat interval (IBI) values under resting conditions with healthy blood flow (Giardino et al., 2002; Schafer & Vagedes, 2013). However, PPG monitoring from the toes, thumb, and earlobes increasingly lags behind the ECG during slow-paced breathing. Phase delay is symmetrical between corresponding recording sites (e.g., left and right index fingers; Allen, 2019).During resting conditions after 1 minute of deep breathing, PPG recordings from the earlobe agree with ECG measurements (Weinschenk et al., 2016). However, the PPG method may be less accurate during slow-paced breathing (Jan et al., 2019) and marked sympathetic activation. Disorders such as anxiety are associated with peripheral vasoconstriction that interferes with detecting the pulse from the digits. In contrast, ECG detection of R-spikes from the chest, torso, or wrists is not affected by vasoconstriction (Giardino et al., 2002; Schafer & Vagedes, 2013; Shaffer & Combatalade, 2013).
To determine which method is more appropriate, a clinician should evaluate whether the raw PPG waveform is flat or low-amplitude (Shaffer & Combatalade, 2013).
Respirometer
Respiratory feedback serves multiple functions during RF assessment as adults breathe from 6.5 to 4.5 bpm in 0.5-bpm steps: pacing, respiration rate (RR) confirmation, and identification of dysfunctional breathing.A respiration display guides clients to breathe at prescribed rates and confirms their success. Both actions are critical because we cannot evaluate the effects of breathing at 5.5 bpm if a client actually breathed at 6 bpm. Respiratory monitoring is also essential to identify dysfunctional breathing behaviors like apnea (breath-holding) and overbreathing (excessive exhaling of CO2), which can interfere with HRV biofeedback.
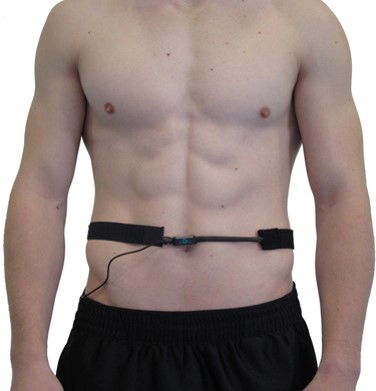
Clinicians use a respirometer, a flexible sensor band that measures abdominal or thoracic movement to detect the respiratory waveform (Shaffer & Moss, 2019). Graphic © BioSource Software LLC.
A clinician should continuously monitor all raw waveforms (ECG or PPG and respirometer) for artifacts (false values) during each slow-paced breathing trial so that they can immediately repeat failed trials.
Orientation for RF Assessment
The resonance frequency assessment protocol (Lehrer et al., 2013) described in this article provides intuitive directions:Today, I am going to introduce you to a method that will help you control your symptoms. We will be using a number of measuring devices, and wearing them may feel a little strange in the beginning. This introduction will allow you to become familiar with what it feels like to wear the sensors, and to watch the body signals they are measuring on the screen, before we start your biofeedback training. I will attach all of the sensors to your body and then you will see what they are measuring on your monitor. These sensors will simply be measuring your physiological activity and will not cause any harm to you. I will briefly explain what each measurement is (p. 98). Attach and test each sensor, start displaying physiological activity, and explain the meaning of the graphs and numerical values. For example: In this top graph, the red line is your heart rate in terms of beats per minute, and the blue line shows your breathing. You’ll notice that the blue line moves up as you breathe in and down as you breathe out (p. 99).A clinician invites questions and provides a brief overview of the RF assessment procedure before starting practice trials. They adjust the explanation to match a client's understanding (Lehrer et al., 2013):
Today we are going to find out the speed of breathing that should best help you to cope with your symptoms. This breathing frequency is different for each person. When you breathe at this rate, your breathing will produce strong effects on your nervous and cardiovascular systems that should be very good for you and should help you to control your symptoms (p. 99). Your heart rate varies with each breath, and with various other processes in your body, including the baroreflex. This variability is good and is a sign of health. We will now find your “resonance frequency” – the speed of breathing at which your HRV is the highest. In this task, we will ask you to breathe at five rates for periods of about 2 min each. You should not find this task difficult. However, if you feel uncomfortable at any time, you can simply stop the task and tell us. When we begin, we will ask you to breathe in and out at a 10-s breathing rate. Then we will ask you to breathe at various other rates, so we can find the exact frequency at which your cardiovascular system resonates. This will be your own resonance breathing frequency. You will be able to use this breathing rate to best help your symptoms. Breathe easily and comfortably, but not too deeply. Do not try too hard. Do you have any questions? (p. 99).
Practice Breathing Trials
Before starting RF trials, clinicians should provide their clients with breathing practice because the protocol requires slower-than-normal breathing rates. This precaution is crucial for clinical populations such as clients diagnosed with chronic pain. Although a healthy resting adult breathes from 12 to 20 bpm (Khazan, 2019a), a RF assessment protocol instructs adults to breathe at less than half that rate.Allow clients to practice healthy breathing from 5.5 to 6 bpm before starting RF trials. When a RR is difficult, instruct them to increase or decrease it by 1/2 bpm. For example, if a client typically breathes at 18 bpm, instruct them to decrease their breathing rate every few seconds from 18 bpm to 17.5 bpm to 17 bpm, and so forth.
Standardize the inhalation-to-exhalation ratio across breathing trials. Longer exhalation than inhalation is recommended in RF assessment (Lehrer et al., 2013) and may increase RSA from baseline values due to a greater increase in cardiac vagal tone (Strauss-Blasche et al., 2000; Van Diest et al., 2014). However, several studies (Zerr et al., 2015; Meehan et al., 2017) found no difference between resting HRV metrics (e.g., HR Max-HR Min, pNN50, RMSSD, SDNN, and LF power) when participants breathed at 1:1 and 1:2 inhalation-to-exhalation ratios.
Resonance Frequency Trials
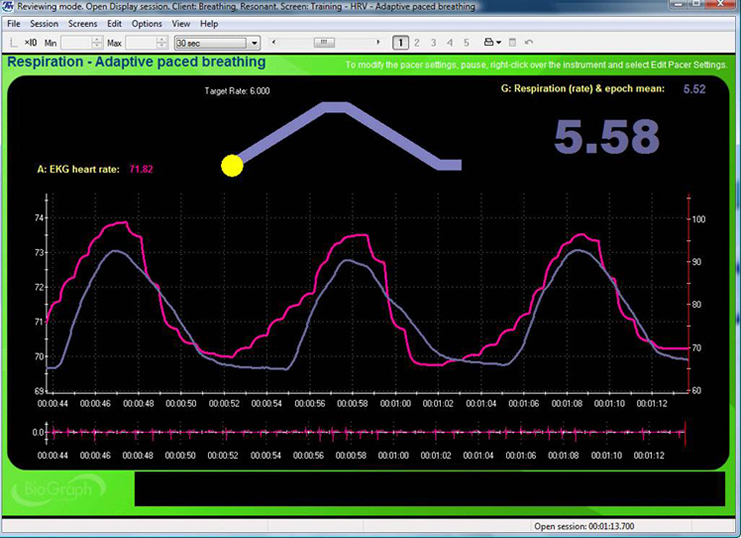
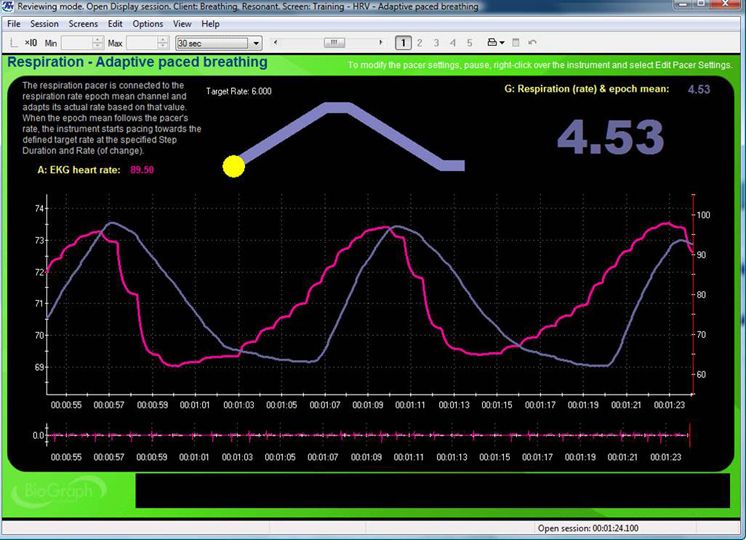
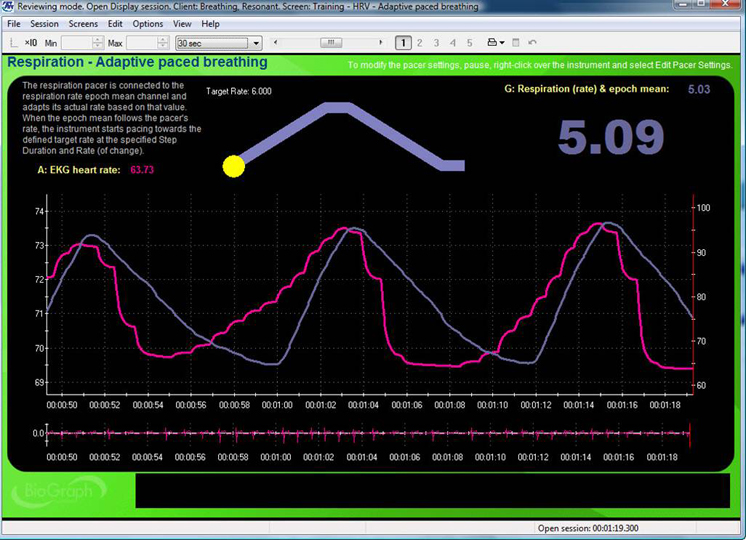
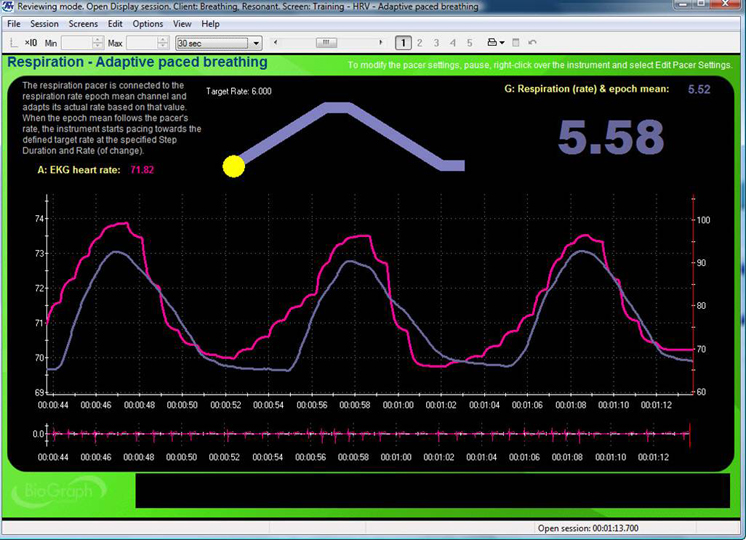
Instruct your client to breathe for 2-minute intervals from 6.5 to 4.5 bpm, decreasing in 0.5 bpm-steps with 2-minute rest periods. Record physiological activity during slow-paced breathing as separate 2-min epochs. Create a separate display for each RF trial and capture 2 minutes of raw breathing and HR waveforms on the same graph for each RR.The top display with the moving yellow ball is designed to help clients breathe at 6 bpm. A post-expiratory pause follows the exhalation. The current respiration rate (5.58 bpm) appears on the right. The graph immediately below shows instantaneous heart rate (pink) and respiration (purple). Note the degree to which the waveform peaks and troughs coincide since this graphically represents phase synchrony. A raw ECG waveform is displayed toward the bottom of the screen. Graphic © BioSource Software LLC.
Consider the following directions when introducing each RR: “Now try breathing at this frequency (following the pacer)” (Lehrer et al., 2013 p. 101).
After your client completes 2 minutes of paced breathing, check on their comfort and verify that they followed the pacer by confirming the average RR for that trial. Repeat trials if the clients were 0.25 bpm too fast or slow. Assessment without a respirometer lacks this quality control. We cannot verify that clients have breathed at the target rates in these cases. Check for artifactual IBIs and repeat invalid epochs after the client has rested for 2 minutes. Examine the segment spectral display for the location of LF peaks. When a peak occurs at 4.5 or 6.5 bpm, extend assessment with trials 0.5 bpm above and below this inflection point until LF amplitude decreases.
Resonance Frequency Selection
Dr. Lehrer explains how to determine the resonance frequency © Association for Applied Psychophysiology and Biofeedback. You can enlarge the video by clicking on the bracket icon at the bottom right of the screen. When finished, click on the ESC key.RF selection aims to identify the frequency that best stimulates the baroreflex system, increasing RSA and HRV. The Lehrer and colleagues (2013) protocol estimates a client's approximate RF because its resolution is limited to 0.5-bpm steps. When a client's actual RF is 5.75 bpm, both 5.5 and 6.0 bpm could maximize different RF selection criteria.
The Lehrer and colleagues strategy incorporates six criteria which are prioritized by their association with resonance effects. Since a single breathing rate may not maximize all six criteria, clinicians select the estimate representing the “best convergence” of the selection criteria (Lehrer et al., 2013, p. 102). These criteria and their weights require experimental confirmation (Shaffer & Meehan, 2020).
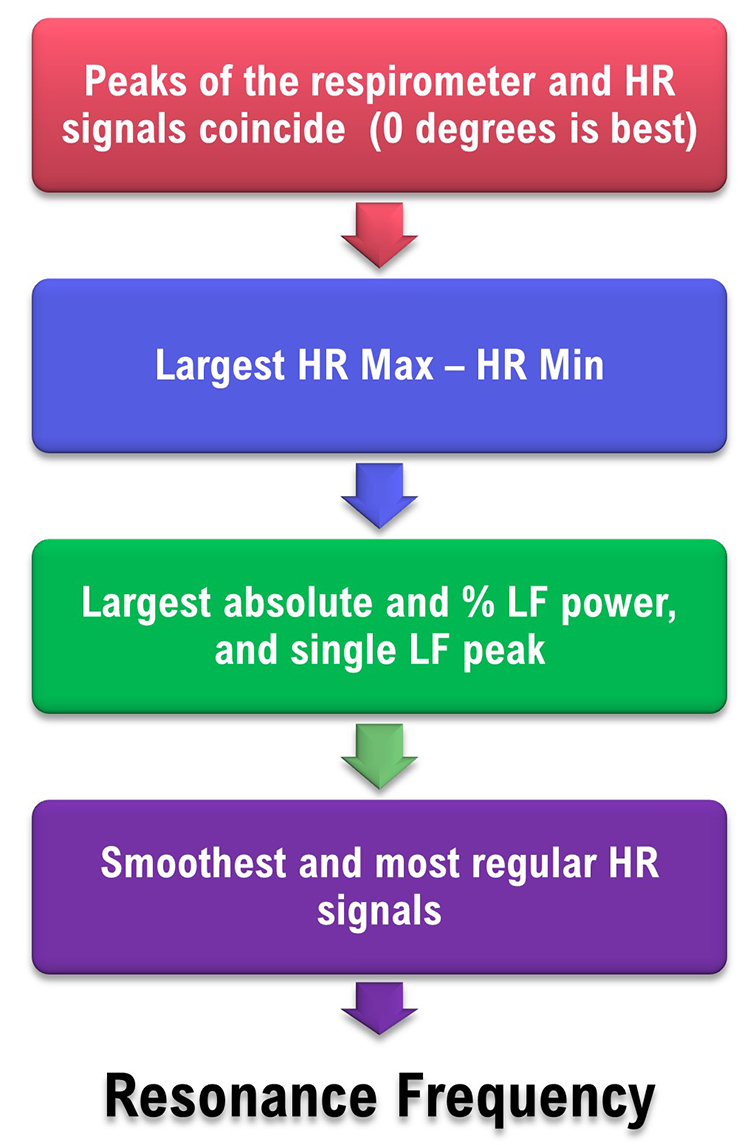
(1) Phase Synchrony
In adults, when respiration and HR signals rise and fall simultaneously (0°), this maximally stimulates the baroreflex and increases RSA (Vaschillo et al., 2004; Lehrer & Gevirtz, 2014; Lehrer et al., 2020a). Whether RSA optimizes pulmonary gas exchange efficiency is currently unclear (Buchheit, 2010). The software measures the phase synchrony between the respirometer and HR waveforms: 0° means that HR begins to rise at the start of an inhalation; 90° means that HR begins to increase during the middle of an inhalation and to decrease during the middle of an exhalation; 180° means that HR decreases during inhalation and increases during exhalation.Phase synchrony (~0°) carries the greatest weight because it enables clients to achieve the greatest resonance effects. Strong resonance effects, in turn, increase RSA and many HRV metrics and allow HRV biofeedback training to more effectively stimulate and strengthen the baroreflex (Lehrer et al., 2003, 2013; Shaffer & Meehan, 2020).
(2) HR Peak-Trough Amplitude
Higher HR peak-trough amplitudes are better because greater RSA can increase baroreflex sensitivity over weeks of HRV RF training (Lehrer et al., 2003; Lehrer & Gevirtz, 2014). HR Max – HR Min is one way to quantify peak-trough amplitude (Cipresso et al., 2019). Clinicians measure HR Max – HR Min using a respirometer to determine when each breathing cycle starts and ends. Peak-trough amplitude is second because larger peak-trough differences signal greater resonance effects and contribute to more effective baroreflex activation (Vaschillo et al., 2002; Shaffer & Meehan, 2020).(3) Low-Frequency Power
The baroreflex system exhibits resonance because it is a feedback system with a constant delay (Lehrer, 2013). Its RF lies within the LF range. Higher absolute and percent total LF power are desirable because they increase as the RR approaches the RF and more effectively stimulates the baroreflex (Vaschillo et al., 2002). Further, cardiac vagal activity increases when individuals engage in slow-paced breathing within the LF range (Kromenacker et al., 2018). Clinicians measure absolute LF power of the 0.04–0.15 Hz range in ms2/Hz. They calculate the percent total LF power as LF/(LF + HF) or LF/(VLF + LF + HF; Lehrer et al., 2013). LF power is third because it confirms that clients are breathing at rates between 4.5 and 6.5 bpm, which are necessary to produce the greatest resonance effects and possibly RSA (Shaffer & Meehan, 2020).(4) Maximum LF Amplitude Peak
Larger LF peaks reflect stronger resonance effects due to greater synchrony between breathing and HR. Clinicians use spectral analysis to identify the LF peak with the largest absolute power. The maximum LF amplitude peak is fourth because the LF spectral peak is higher at the RF than at any other respiratory frequency (Lehrer et al., 2013). When clients breathe consistently within the LF range, this increases resonance effects and RSA (Shaffer & Meehan, 2020).(5) Smoothness of the HR Curve Envelope
Smooth heart rate waveforms are best because they permit closer phase synchrony with respiration waveforms and allow clients to achieve the greatest resonance effects and RSA (Lehrer and Gevirtz, 2014). Clinicians visually inspect HR curve envelope for their smoothness. Sinusoidal signals are smooth, whereas jagged waveforms are irregular (Lehrer et al., 2013). The smoothness of the HR curve envelope is fifth because it reflects the breathing mechanics required to achieve the greatest resonance effects and RSA (Shaffer & Meehan, 2020).(6) Fewest LF Peaks
Fewer peaks are better than more peaks because they are generated by breathing within a narrower frequency band about the RF within the LF range. Clients can generate multiple peaks when they breathe slightly faster or slower than their RF. This can result in a peak at the respiratory rate and another at the baroreflex frequency. In contrast to breathing at various frequencies in the LF range, breathing at a single frequency better enables phase synchrony between breathing and HR, stimulates the baroreflex, and increases RSA (Vaschillo et al., 2002). Clinicians can count the number of LF peaks by visually inspecting a spectral display of the LF range. The fewest LF peaks is sixth because this demonstrates that the client is consistently breathing within a narrow band within the LF range, which increases resonance effects and RSA (Shaffer & Meehan, 2020).The table below is adapted from Lehrer and colleagues' (2013) RF assessment protocol.
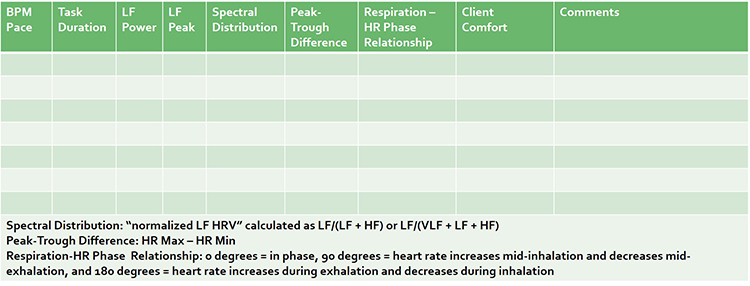
Resonance Frequency Selection
The RF is the breathing rate that represents the “best convergence” of these criteria (Lehrer et al., 2013, p. 102):1. synchrony of the respirometer and HR signals
2. largest peak-to-trough HR amplitude
3. largest absolute and percentage LF power, and highest amplitude LF peak frequency near 0.1 Hz
4. smoothest and most regular HR waveforms
Selecting the RF Using Actual Data
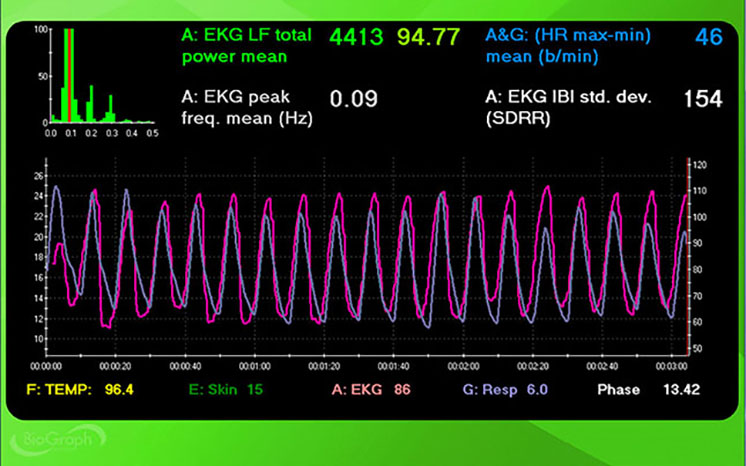
Using the Lehrer et al. (2013) criteria, we might choose a respiration rate of 5.5 bpm due to its synchrony (7o), peak-to-trough difference (49 bpm), HR curve envelope smoothness (+), and the number of LF peaks (+).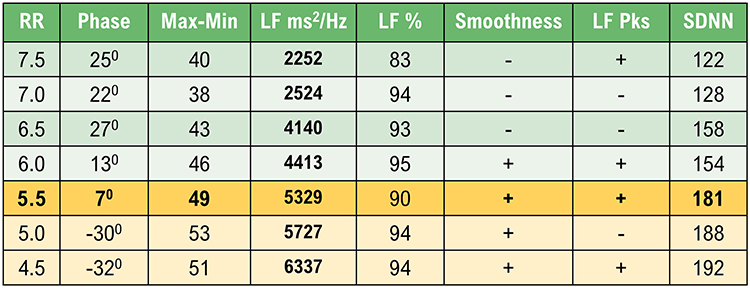
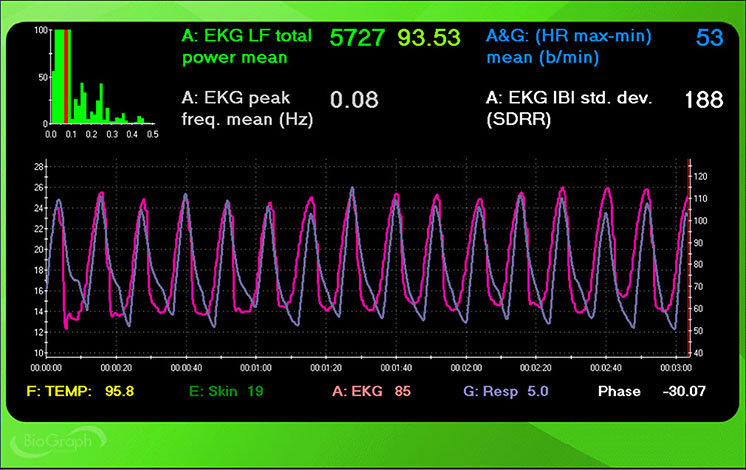
However, a clinician could also make a case for 5.0 and 4.5 bpm. Despite dramatically worse phase, 5.0 and 4.5 bpm achieved higher peak-to-trough differences (53 and 51 bpm), LF power (5727 and 6337 ms2/Hz), LF % (both 94), and SDNN (188 and 192 ms) than 5.5 bpm.
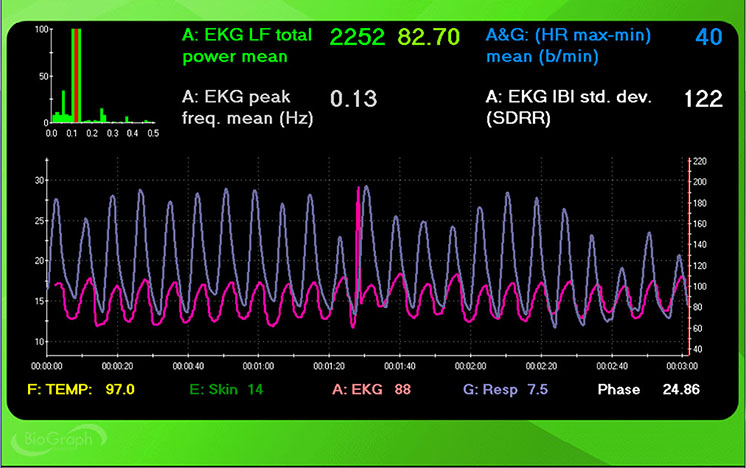
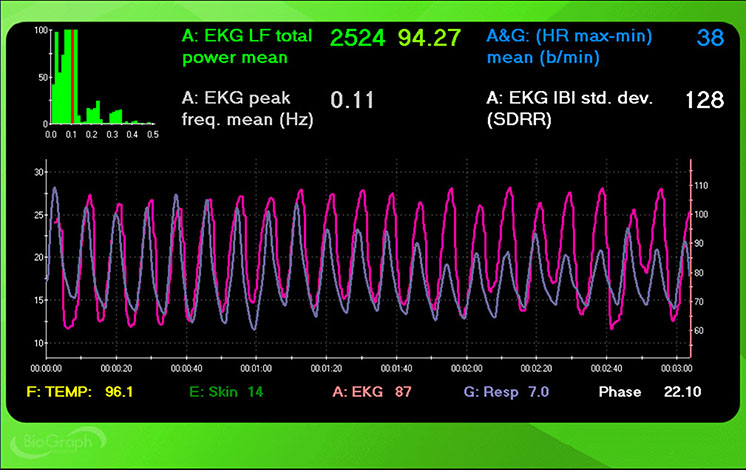
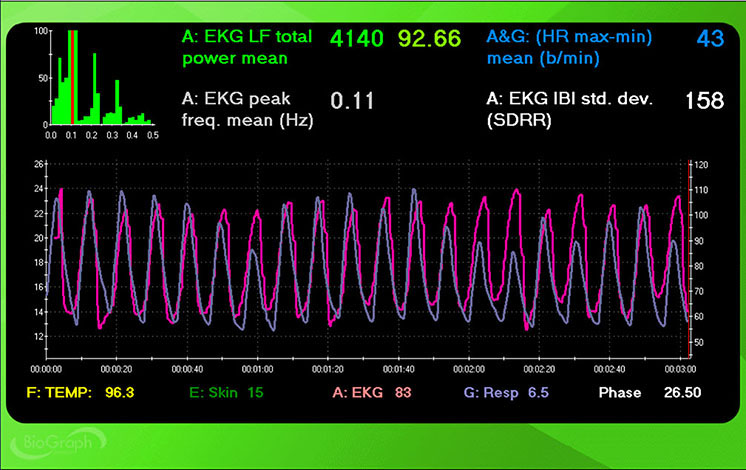
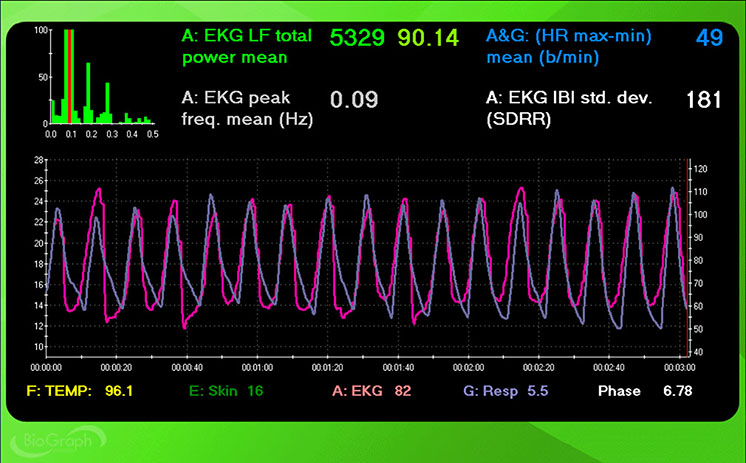
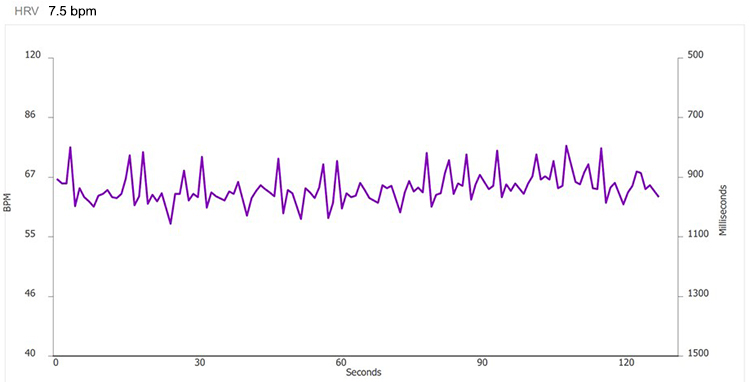
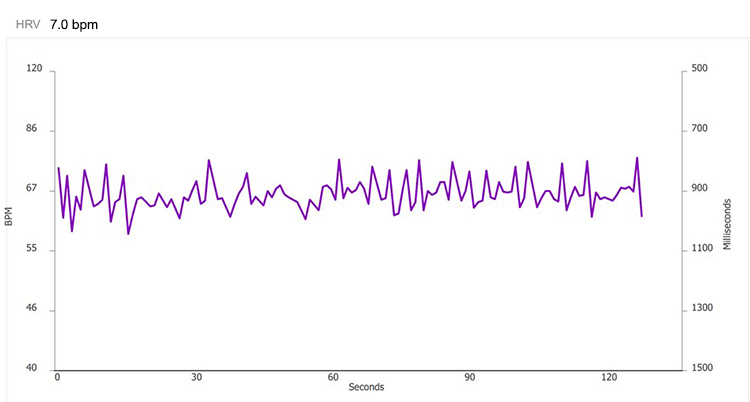
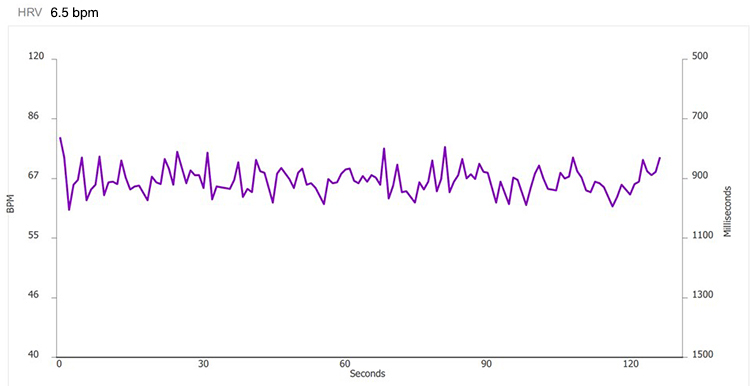
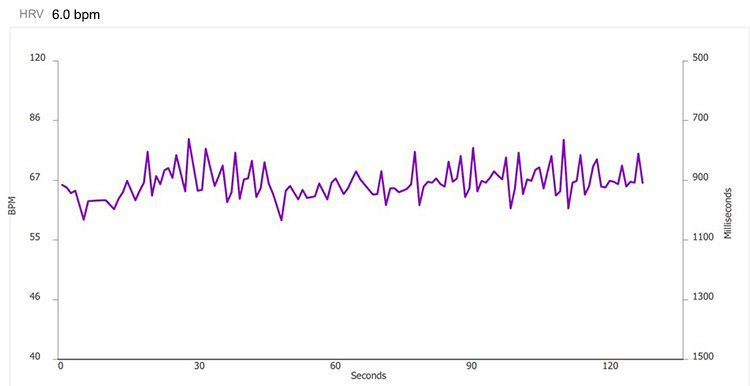
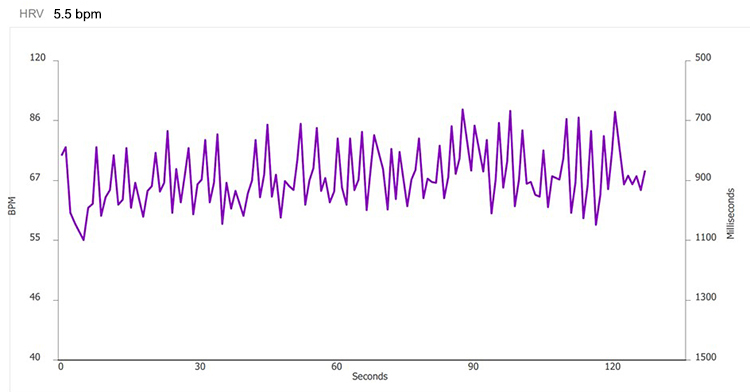
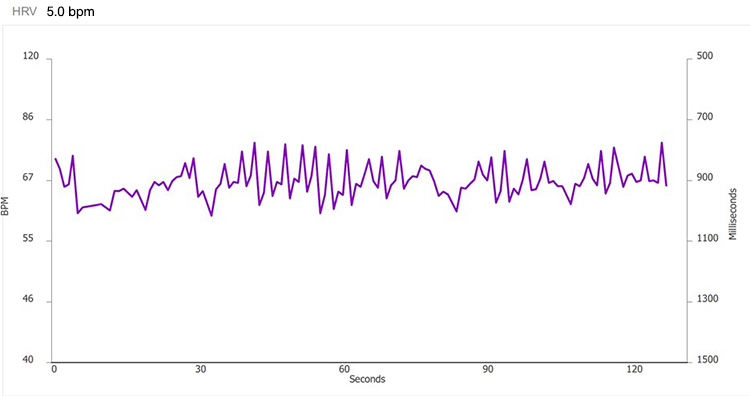
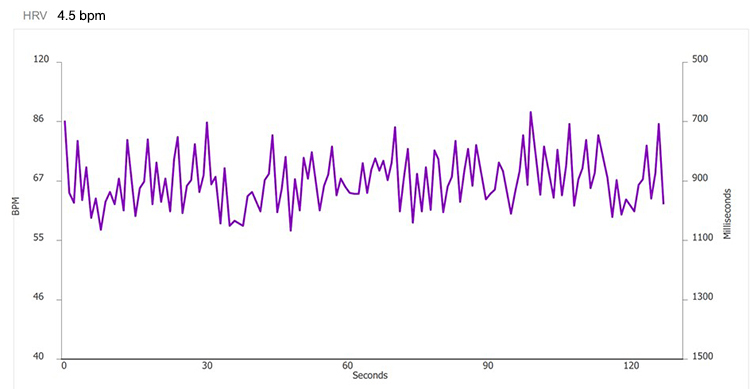
Screenshots for each breathing trial (7.5 to 4.5 bpm) display HR and respiration waveforms. The pink tracing shows instantaneous HR, and the violet tracing shows respirometer expansion and contraction.
7.5 bpm
7.0 bpm
6.5 bpm
6.0 bpm
5.5 bpm
5.0 bpm
4.5 bpm

How to Break Ties
Although slow-paced breathing at 5.5, 5.0, and 4.5 should increase RSA and HRV, it is critical to select the rate that your client finds most comfortable and rewarding. A client-friendly rate will increase your client's likelihood of practicing RF breathing. For example, if your client struggles with breathing at 4.5 bpm, this pace may result in overbreathing and vagal withdrawal, discomfort, and reduced engagement (Porges, 1995; Thayer et al., 2012).Also, consider which rate brings your clients closest to their training goal? If your clients entered training to reduce BP, consider the frequency that produces the lowest readings.
How to Fine-Tune the RF

Following a resting baseline at the start of the first training session, clinicians should monitor 3–5 min of breathing at the RF while watching for signs of overbreathing like faintness and tingling of the extremities (Lehrer et al., 2013). If such symptoms are present, clinicians should encourage shallower breathing to reduce the CO2 loss responsible for them.
Next, they should ask clients to breathe at rates that are 1/2-bpm faster and slower for 3–5 min each. This step allows clients to compare their subjective comfort one more time during each breathing rate. Finally, after artifacting, clinicians should evaluate the three trials – RF, RF + 1/2-bpm, and RF - 1/2-bpm – using the previous RF criteria.
Stepped Protocol Difficulties
Slow-paced breathing can be challenging for clients who breathe at average or higher-than-typical rates. In addition to slowing their RR, the RF protocol may ask them to lengthen their exhalation. Although clients may breathe at the target rate on average during RF trials, they may not consistently follow the pacing display.Variability around each target RR could compromise most of the selection criteria. Specifically, these fluctuations could reduce phase synchrony, lower the maximum LF peak, decrease the smoothness of the HR curve envelope, and increase the number of LF peaks. These criteria appear to measure slow-paced breathing proficiency rather than baroreflex frequency.
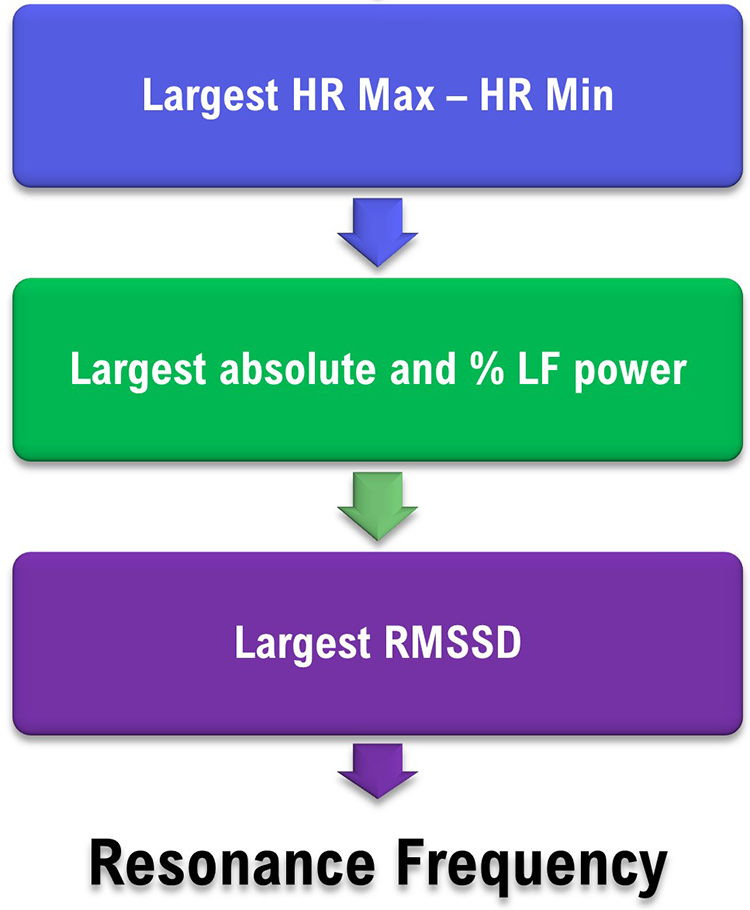
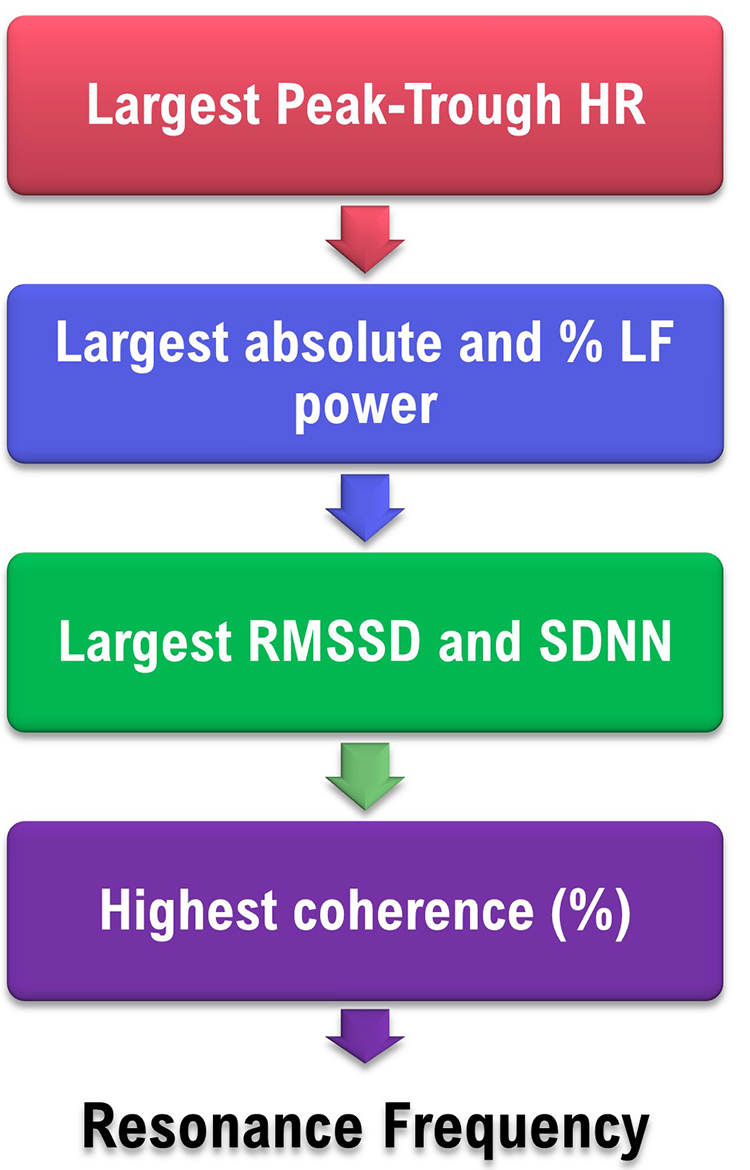
Perhaps the largest peak-trough amplitude and LF power (absolute and percentage) should be the primary RF criteria since they are less affected by breathing proficiency. Also, since RMSSD is a robust short-term HRV index, it should be evaluated as the third criterion. We present a simplified decision flowchart to stimulate conversation and research.
Sliding Protocol
Fisher and Lehrer (2022) described a 15-min automated sliding protocol in which participants breathed between 4.25 and 6.5 bpm, with a constant 67.04-ms rate of change. Since peak-trough amplitude proportionally increases as clients approach the RF, the sliding protocol measures this metric at 78 frequencies. In contrast to the subjectively weighted multiple criteria of the stepped approach, the sliding protocol identifies the frequency with the largest peak-trough amplitude.The mean absolute difference in RF between the two methods was 0.22 ± 0.169 bpm. The authors raise the issue of whether this slight difference between RF estimates is too small to affect physiological or psychological outcomes.
Alternative Methods to Find the RF Using emWave Pro Plus ®
Clinicians can use this method for distance HRV biofeedback training. A limitation is that the absence of a respirometer prevents confirmation that a client breathed at the required rates. This modified protocol uses an integrated or external breathing pacer. You will need to visually confirm client success in following a pacer utilizing a webcam by counting breaths over each 2-minute period. We will describe an approach using the emWave Pro Plus ®.
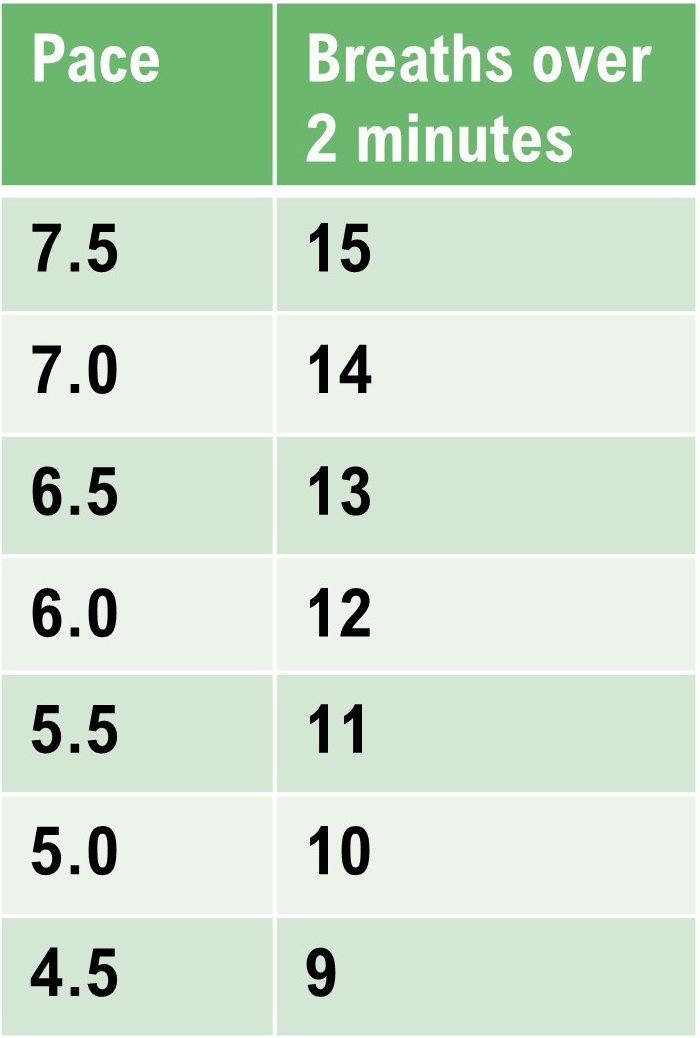
Method 1: emWave Pro Plus ® with a separate smartphone pacer
Perform a series of 2-minute Assessments using the emWave Pro Plus® and a separate breathing pacer while the client sits upright. Adults will breathe from 7.5 to 4.5 bpm in descending 0.5 bpm steps. Use 9.5 to 6.5 bpm for children. After each 2-minute trial, inquire about hyperventilation symptoms like feeling lightheaded, dizzy, or having a pounding heart. Set the emWave Pro Plus Assessment for 2 minutes.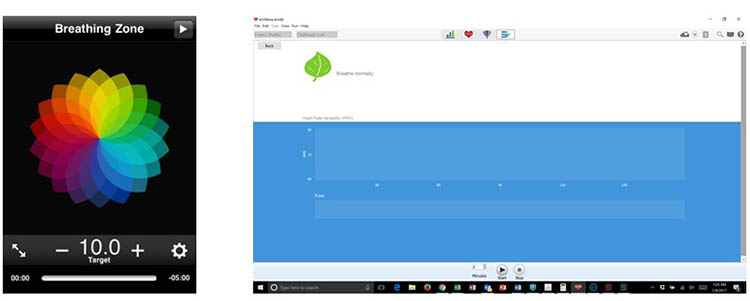
After completing the 2-minute Assessments, visually inspect the data points to ensure that emWave Pro Plus has deleted all false beats (shown by a circled red x). Below, there are two false beats near the top of the tachogram, around 14 seconds and 53 seconds. Use Edit to delete any overlooked false beats.
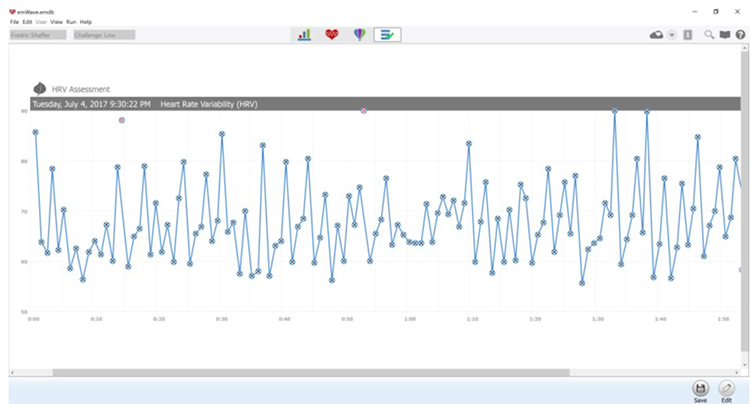
After you complete artifacting, run a separate report for each trial. Then, compare the HR tachograms and summary statistics. Compare the HR tachograms and HRV measurements for each breathing trial on separate PowerPoint slides or a Word document.
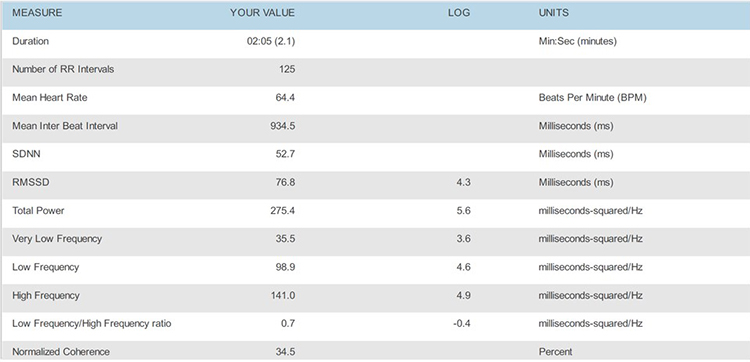
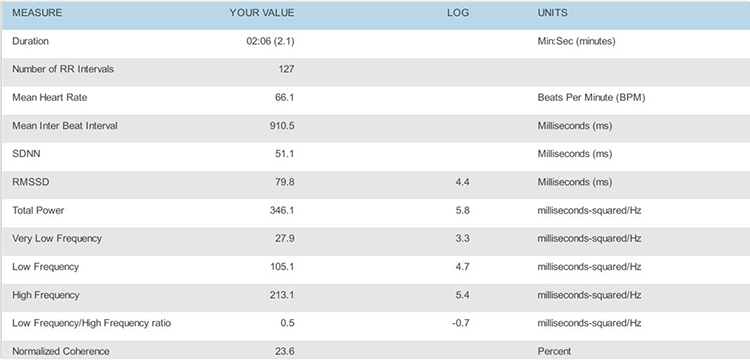

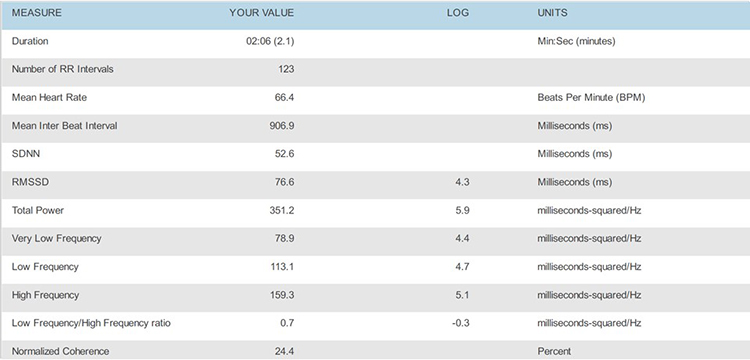
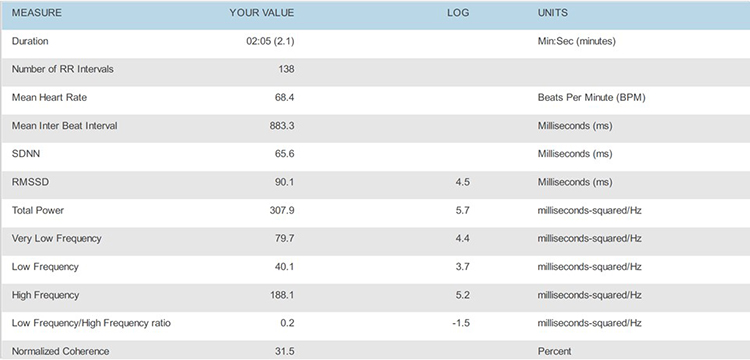
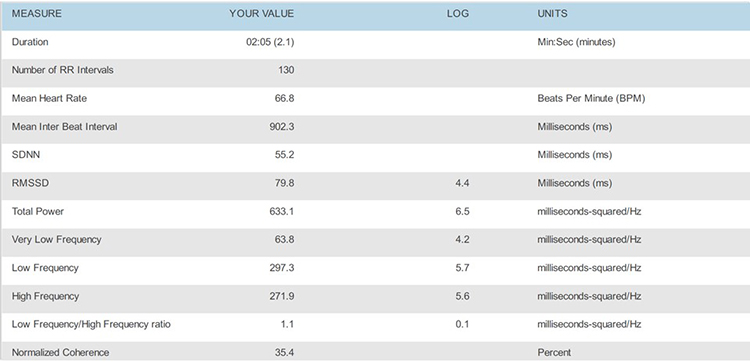
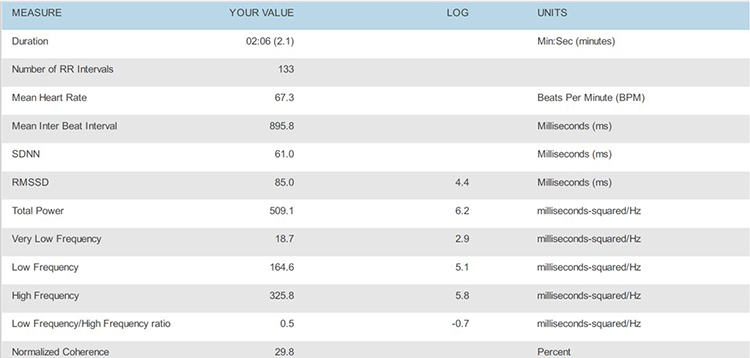
Place the HRV time-domain and frequency-domain values in a table.
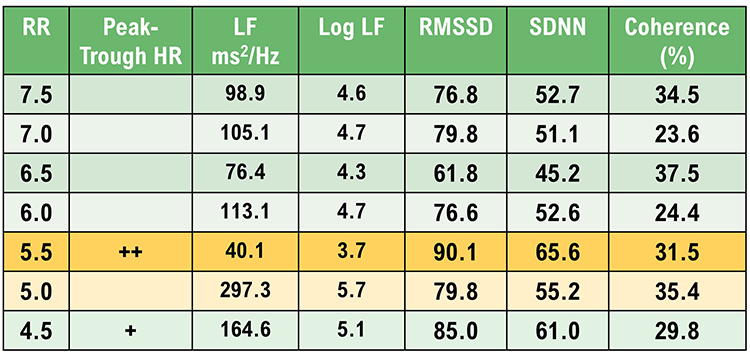
Select the RF using in descending order: peak-trough HR, largest LF LF normalized power, RMSSD and SDNN, and coherence.
Decision
This client’s RF is either 5.5 or 5.0 bpm based on peak-trough HR, LF power (absolute and %), RMSSD, SDNN, and coherence. The strongest case can be made for 5.5 bpm for its peak-trough HR, RMSSD, and SDNN values.
The choice may come down to your client’s preference. Confirm the RF during the next session by a series of 2-minute trials at the RF, and one-half breath faster and slower.
Can the Coherence Score Identify the RF?
At least for this case, the highest coherence score (37.5%) would have selected one of the least promising frequencies. Breathing at 6.5 bpm was associated with lower peak-trough HR, LF power (absolute and %), RMSSD, and SDNN. Following Lehrer, we encourage RF selection based on a "convergence" of measurements.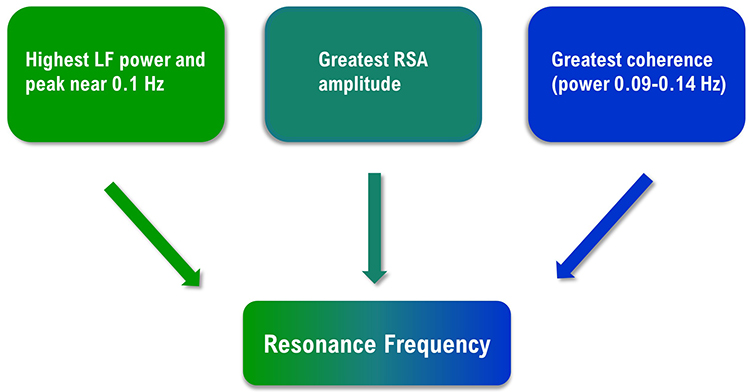
Unanswered Questions
Four significant questions regarding RF assessment require further research. These questions include whether RF training is more effective than 6-bpm slow-paced breathing, the minimum epoch required for valid RF measurements, the Lehrer protocol’s test-retest reliability, and whether rhythmic skeletal muscle tension can replace slow-paced breathing in RF assessment.
Does RF training produce superior outcomes?
While initial studies (Lin et al., 2012; Steffen et al., 2017) found evidence that RF training produces greater systolic blood pressure reductions and more positive mood, a recent meta-analysis (Lehrer et al., 2020a) found non-significant effects on diastolic or systolic blood pressure. Due to the different pathomechanics underlying different disorders, researchers may need to answer this question one disorder at a time (Shaffer & Meehan, 2020).What minimum epoch is required to obtain valid resonance frequency measurements?
Although clinicians may assume that 2-minute recordings achieve acceptable concurrent validity with respect to 5-minute recordings, no peer-reviewed study has demonstrated this result for the most critical RF criteria: heart rate-respiration phase synchrony and HR Max-HR Min.Different epoch lengths may be required for acceptable concurrent validity of related HRV metrics like LF and normalized LF power. Shaffer et al. (2019) evaluated the concurrent validity of these indices in 38 healthy undergraduates. Their concurrent validity criteria included a Pearson’s correlation value = 0.90 and a Bland–Altman limits of agreement allowable difference of ± 5% of the 5-minute value range. Whereas 90-s epochs were sufficient to measure LF power, 180-s records were needed to estimate 5-minute normalized LF power. Researchers should investigate the concurrent validity of all four measures with a larger, more representative sample (Shaffer & Meehan, 2020).
How reliable is RF assessment?
Wally et al. (2011) reported that the RF was stable (r = 0.73. d = 2.14) over a 2-week interval. The authors monitored 21 undergraduate participants using an ECG and respirometer. They required that RR be within 0.25 bpm of the target rate.Capdevila and colleagues (2021) found that the mean group RF was stable from pretest to posttest (6.1 versus 5.9 bpm), as were the group modes (6 versus 6 bpm). However, a granular analysis found that 66.7% of RFs changed from pretest to posttest--although the authors did not specify what constituted a RF change.
The authors failed to use a respirometer to confirm that participants breathed at the target rates and a 1:1 inhalation-to-exhalation (I-E) ratio. Instead, they inferred whether participants followed the paced rhythm by examining each trial's FFT power spectrum. They provided no evidence that this indirect method ensured that participants breathed within 0.25 bpm of the target rate. Additionally, they did not attempt to confirm that their participants breathed at a 1:1 I-E ratio. Without confirmation that participants breathed at the target rates and I-E ratio, inconsistency in breathing could have accounted for individual pretest-posttest RF changes.
The question of test-retest reliability is pivotal for resonance frequency assessment. Why invest an entire session measuring the RF if it changes significantly across training sessions? Researchers should replicate the Wally et al. (2011) findings at a more appropriate 1:2 I-E ratio and a larger and more representative sample.
Could rhythmic skeletal muscle tension replace slow-paced breathing in RF assessment?
Rhythmic skeletal muscle tension (RSMT) can stimulate the baroreflex like resonance frequency breathing and increase LF HRV power (Vaschillo et al., 2011). In this study, participants placed in a semi-recumbent position rhythmically contracted their hands and feet 3, 6, and 12 times per min. RSMT only produced high-amplitude oscillations in blood pressure, heart rate, and vascular tone at 6 contractions per min (cpm) – which is a frequency of 0.1 Hz.These findings raise the possibility that clinicians could use RSMT in place of slow-paced breathing to measure the RF and deliver HRV biofeedback training. The RSMT protocol would avoid the challenging requirement that individuals breathe at prolonged rates (e.g., 4.5–6.5 bpm). Before this protocol can be adopted, research will have to prove that it achieves acceptable criterion validity – confirmation that test scores accurately estimate scores of validated measures (Gulliksen, 1987) – with respect to slow-paced breathing and test-retest validity (Shaffer & Meehan, 2020).

What does it mean when the HR tracing peaks before the respirometer tracing during RF assessment?
When the HR tracing (pink) peaks before the respirometer tracing (violet), as in the screens for 4.5 and 5.0 bpm, the client's RR is below their RF. The right screen shows that the HR and respirometer peaks align at 5.5 bpm.
 |
 |
 |
Glossary
baroreflex gain: HR change per 1 mmHg change in BP.
coherence: self-coherence; signal power in the 0.09-0.14 region of the LF band.
frequency-domain measures of HRV: the calculation of the absolute or relative power of the HRV signal within four frequency bands.
high-frequency (HF) band: the HRV frequency range from 0.15-.40 Hz that represents the Inhibition and activation of the vagus nerve by breathing (RSA).
HR Max-HR Min: a HRV index that calculates the average difference between the highest and lowest HRs during each respiratory cycle.
interbeat interval (IBI): the time interval between the peaks of successive R-spikes (initial upward deflections in the QRS complex). The IBI is also called the NN (normal-to-normal) interval.
low-frequency (LF) band: the HRV frequency range of 0.04-0.15 Hz that may represent the influence of PNS and baroreflex activity (when breathing at resonance frequency).
peak-trough HR: the difference between the fastest and slowest HR in each breathing cycle.
resonance frequency: the frequency at which a system, like the cardiovascular system, can be activated or stimulated.
respiratory sinus arrhythmia (RSA): respiration-driven heart rhythm that contributes to the high frequency (HF) component of heart rate variability. Inhalation inhibits vagal nerve slowing of the heart (increasing HR), while exhalation restores vagal slowing (decreasing HR).
respirometer: a sensor that changes resistance to a current as it expands and contracts during the respiratory cycle.
SD1: the standard deviation of the distance of each point from the y = x-axis that measures short-term HRV.
time-domain measures of HRV: indices like SDNN that measure the degree to which the IBIs between successive heartbeats vary.
very-low-frequency (VLF) band: the HRV frequency range of 0.003-0.04 Hz that may represent temperature regulation, plasma renin fluctuations, endothelial and physical activity influences, and possible intrinsic cardiac, PNS, and SNS contributions.
REVIEW FLASHCARDS ON QUIZLET
Click on the Quizlet logo to review our chapter flashcards.
Assignment
These recordings were from a chronic pain patient who received treatment in an interdisciplinary chronic pain program. Look at the summary screens for pacing at 6.5 and 6.0 breaths per minute. Based on these data, which respiration rate is closer to the client's resonance frequency? Why?
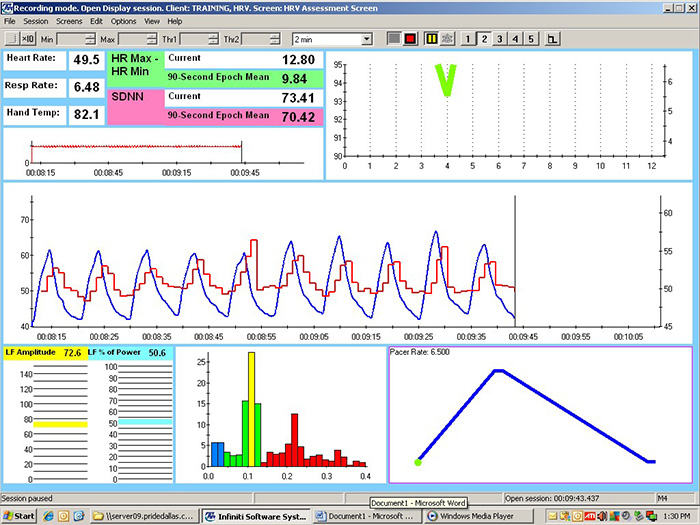
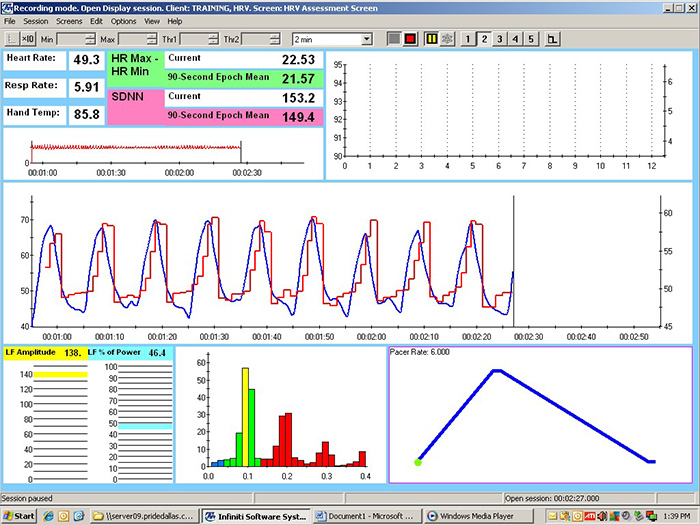
Check the mean respiration rates to confirm that this client breathed at the pacing rates. He did. Examine the values for HR Max - HR Min and LF amplitude. Both were higher at 6.0 than 6.5. Inspect the synchrony of the HR and respirometer tracings. The peaks and valleys of these tracing were more closely aligned at 6.0 than 6.5 breaths per minute. Finally, compare the hand temperatures. His hands were almost 4 degrees F warmer at 6.0 than 6.5. The overall pattern of his measurements argues for training at 6.0 breaths per minute. If the clinic had monitored skin conductance during this session, it might have decreased at the breathing rate closest to his resonance frequency.
References
Allen, J. (2019). Quantifying the delays between multi-site photoplethysmography pulse and electrocardiogram R-R interval changes under slow-paced breathing. Front. Physiol.,10, 1190. https://doi.org/ 10.3389/fphys.2019.01190
Buchheit, M. (2010). Respiratory sinus arrhythmia and pulmonary gas exchange efficiency: Time for a reappraisal. Exp. Physiol., 95, 767. https://doi.org/10.1113/expphysiol.2010.053470
Capdevila, L., Parrado, E., Ramos-Castro, J., Zapata-Lamana, R., & Lalanza, J. F. (2021). Resonance frequency is not always stable over time and could be related to the inter-beat interval. Scientific Reports, 11, 8400. https://doi.org/10.1038/s41598-021-87867-8
Cipresso, P., Colombo, D., & Riva, G. (2019). Computational psychometrics using psychophysiological measures for the assessment of acute mental stress. Sensors, 19, 781. https://doi.org/10.3390/s19040781
Fisher, L. R., & Lehrer, P. M. (2022). A method for more accurate determination of resonance frequency of the cardiovascular system, and evaluation of a program to perform It. Applied psychophysiology and biofeedback, 47(1), 17–26. https://doi.org/10.1007/s10484-021-09524-0
Gevirtz, R. N. (2005). Heart rate variability biofeedback in clinical practice. AAPB Fall workshop.
Giardino, N. D., Lehrer, P. M., & Edelberg, R. (2002). Comparison of finger plethysmograph to ECG in the measurement of heart rate variability. Psychophysiology, 39, 246–253. https://doi.org/10.1111/1469-8986.3920246
Gulliksen, H. (1987). Theory of mental tests. Erlbaum.
Jan, H. Y., Chen, M. F., Fu, T. C., Lin, W. C., Tsai, C. L., & Lin, K. P. (2019). Evaluation of coherence between ECG and PPG derived parameters on heart rate variability and respiration in healthy volunteers with/without controlled breathing. J. Med. Biol. Eng., 39, 783–795. https://doi.org/0.1007/s40846-019-00468-9
Khazan, I. (2019a). Biofeedback and mindfulness in everyday life: Practical solutions for improving your health and performance. W. W. Norton & Company.
Khazan, I. (2019b). A guide to normal values in biofeedback. Physiological recording technology and applications in biofeedback and neurofeedback. In D. Moss & F. Shaffer (Eds.). Association for Applied Psychophysiology and Biofeedback, 2–6.
Khazan, I. Z. (2013). The clinical handbook of biofeedback: A step-by-step guide for training and practice with mindfulness. Wiley-Blackwell.
Lehrer, P., Kaur, K., Sharma, A., Shah, K., Huseby, R., Bhavsar, J., Sgobba, P., & Zhang, Y. (2020a). Heart rate variability biofeedback improves emotional and physical health and performance: A systematic review and meta-analysis. Applied Psychophysiology and Biofeedback, 45, 109–129. https://doi.org/10.1007/s10484-020-09466-z
Lehrer, P., Vaschillo, B., Zucker, T., Graves, J., Katsamanis, M., Aviles, M., & Wamboldt, F. (2013). Protocol for heart rate variability biofeedback training. Biofeedback, 41(3), 98-109. https://doi.org/10.5298/1081-5937-41.3.08
Lehrer, P. M. (2013). Personal communication regarding the test-retest reliability of the resonance frequency in adults.
Lehrer, P. M., & Gevirtz, R. (2014). Heart rate variability: How and why does it work? Frontiers in Psychology. https://doi.org/10.3389/fpsyg.2014.00756
Lehrer, P. M., Vaschillo, E., & Vaschillo, B. (2000). Resonant frequency biofeedback training to increase cardiac variability: Rationale and manual for training. Applied Psychophysiology and Biofeedback, 25(3), 177-191. https://doi.org/10.5298/1081-5937-41.3.08
Lin, G., Xiang, Q., Fu, X., Wang, S., Wang, S., Chen, S., . . . Wang, T. (2012). Heart rate variability biofeedback decreases blood pressure in prehypertensive subjects by improving autonomic function and baroreflex. J. Altern. Complement. Med., 18, 143–152. https://doi.org/10.1089/acm.2010.0607
Meehan, Z., Muesenfechter, N., Gravett, N., Watson, T., Smith, A., Shearman, S., . . . Shaffer, F. (2017). A 1:2 inhalation-to-exhalation ratio does not increase heart rate variability during 6-bpm breathing [Abstract]. Applied Psychophysiology and Biofeedback, 45, 110–111. https://doi.org/10.1007/s10484-018-9390-8
Peper, E., Gibney, K. H., Tylova, H., Harvey, R., & Combatalade, D. (2008). Biofeedback mastery: An experiential teaching and self-training manual. Association for Applied Psychophysiology and Biofeedback.
Schafer, A., & Vagedes, J. (2013). How accurate is pulse rate variability as an estimate of heart rate variability? A review on studies comparing photoplethysmographic technology with an electrocardiogram. Int. J. Cardiol., 166, 15–29. https://doi.org/10.1016/j.ijcard.2012.03.119
Shaffer, F., & Combatalade, D. (2013). Don’t add or miss a beat: a guide to cleaner heart rate variability recordings. Biofeedback, 41, 121–130. https://doi.org/10.5298/1081-5937-41.3.04
Shaffer, F., & Meehan, Z. M. (2020). A practical guide to resonance frequency assessment for heart rate variability biofeedback. Frontiers in Neuroscience. https://doi.org/10.3389/fnins.2020.570400
Shaffer, F., & Moss, D. (2019). Biofeedback. Brain and heart dynamics. In D. Bugada, V. Bellini, E. G. Bignami, & L. F. Lorini (Eds.). Springer, 1–15.
Steffen, P. R., Austin, T., DeBarros, A., & Brown, T. (2017). The impact of resonance frequency breathing on measures of heart rate variability, blood pressure, and mood. Front. Public Health, 5, 222. https://doi.org/10.3389/fpubh.2017.00222
Strauss-Blasche, G., Moser, M., Voica, M., McLeod, D., Klammer, N., & Marktl, W. (2000). Relative timing of inspiration and expiration affects respiratory sinus arrhythmia. Clin. Exp. Pharmacol. Physiol., 27, 601–606. https://doi.org/10.1046/j.1440-1681.2000.03306.x
Vaschillo, E., Lehrer, P., Rishe, N., & Konstantinov, M. (2002). Heart rate variability biofeedback as a method for assessing baroreflex function: A preliminary study of resonance in the cardiovascular system. Applied Psychophysiology and Biofeedback, 27(1), 1-27. https://doi.org/10.1023/a:1014587304314
Van Diest, I., Verstappen, K., Aubert, A. E., Widjaja, D., Vansteenwegen, D., & Vlemincx, E. (2014). Inhalation/exhalation ratio modulates the effect of slow breathing on heart rate variability and relaxation. Applied Psychophysiology and Biofeedback, 39, 171–180. https://doi.org/10.1007/s10484-014-9253-x
Vaschillo, E. G., Vaschillo, B., & Lehrer, P. M. (2004). Heartbeat synchronizes with respiratory rhythm only under specific circumstances. Chest, 126, 1385–1386. https://doi.org/10.1016/S0012-3692(15)31329-5
Vaschillo, E. G., Vaschillo, B., Pandina, R. J., & Bates, M. E. (2011). Resonances in the cardiovascular system caused by rhythmical muscle tension. Psychophysiology, 48, 927-936. https://dx.doi.org/10.1111%2Fj.1469-8986.2010.01156.x
Wally, C., Korenfeld, I., Brooks, K., Carrell, D., Lau, D., Peterson, J., Schafer, M., Truitt, A., Fuller, J., Westermann-Long, A., & Korenfeld, D. (2011). Resonance frequency measurements are reliable [Abstract]. Poster presented at the meeting of the Association for Applied Psychophysiology and Biofeedback, New Orleans, Louisiana.
Weinschenk, S. W., Beise, R. D., & Lorenz, J. (2016). Heart rate variability (HRV) in deep breathing tests and 5-min short-term recordings: Agreement of ear photoplethysmography with ECG measurements, in 343 subjects. Eur. J. Appl. Physiol., 116, 1527–1535. https://doi.org/10.1007/s00421-016-3401-3
Zerr, C., Kane, A., Vodopest, T., Allen, J., Hannan, J., Fabbri, M., . . . Shaffer, F. (2015). Does inhalation-to-exhalation ratio matter in heart rate variability biofeedback? [Abstract]. Applied Psychophysiology and Biofeedback, 40(2), 135. https://doi.org/10.1007/s10484-015-9282-0
C. BREATHING TRAINING
Breathing assessment provides a roadmap for training clients to replace dysfunctional breathing with healthy breathing. Correcting breathing fundamentals is critical for heart rate variability biofeedback (HRVB) using paced breathing at the resonance frequency (RF) or 6 breaths per minute. Most clients must learn to rely more on their diaphragm to ventilate the lungs, slow their respiration rate (RR), and breathe consistently to produce robust resonance effects.
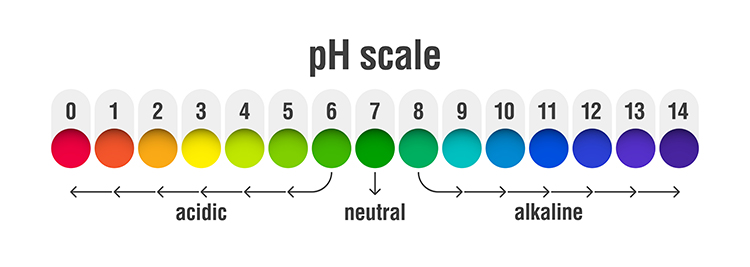
Shifting to a healthy breathing pattern corrects overbreathing by conserving 85-88% of CO2 (Khazan, 2021). Preserving CO2 lowers blood pH, weakens the bond between hemoglobin and oxygen, and increases nitric oxide and oxygen delivery to body tissues courtesy of the Bohr effect. Healthy breathing dilates blood vessels, slows heart rate (HR), increases respiratory sinus arrhythmia (RSA) and heart rate variability (HRV), and lowers blood pressure (BP). Graphic © fizkes/Shutterstock.com.

This section covers Common Breathing Misconceptions, Healthy Breathing Roadmap, Medical Cautions, Breathing Basics, Physiological Effects of Healthy Breathing, Modalities for Teaching Healthy Breathing, Healthy Breathing Training, and Breathing Practice.
Appreciation
This unit draws heavily on Dr. Inna Khazan's clinical experience and extensive writing and presentations on healthy breathing.

Common Breathing Misconceptions
At rest, we do not need more oxygen! Near sea level, the air that we inhale contains 21% oxygen, whereas the air we exhale contains 15% oxygen. Graphic © Stephen P. Crane/Shutterstock.com.

We only use one-fourth of inhaled oxygen and don't need more. We need to conserve CO2 by retaining 85-88% of its volume (Khazan, 2021).
Healthy Breathing Roadmap
Evaluate breathing during a psychophysiological assessment, correct breathing fundamentals, and then teach RF breathing to exercise the baroreflex.
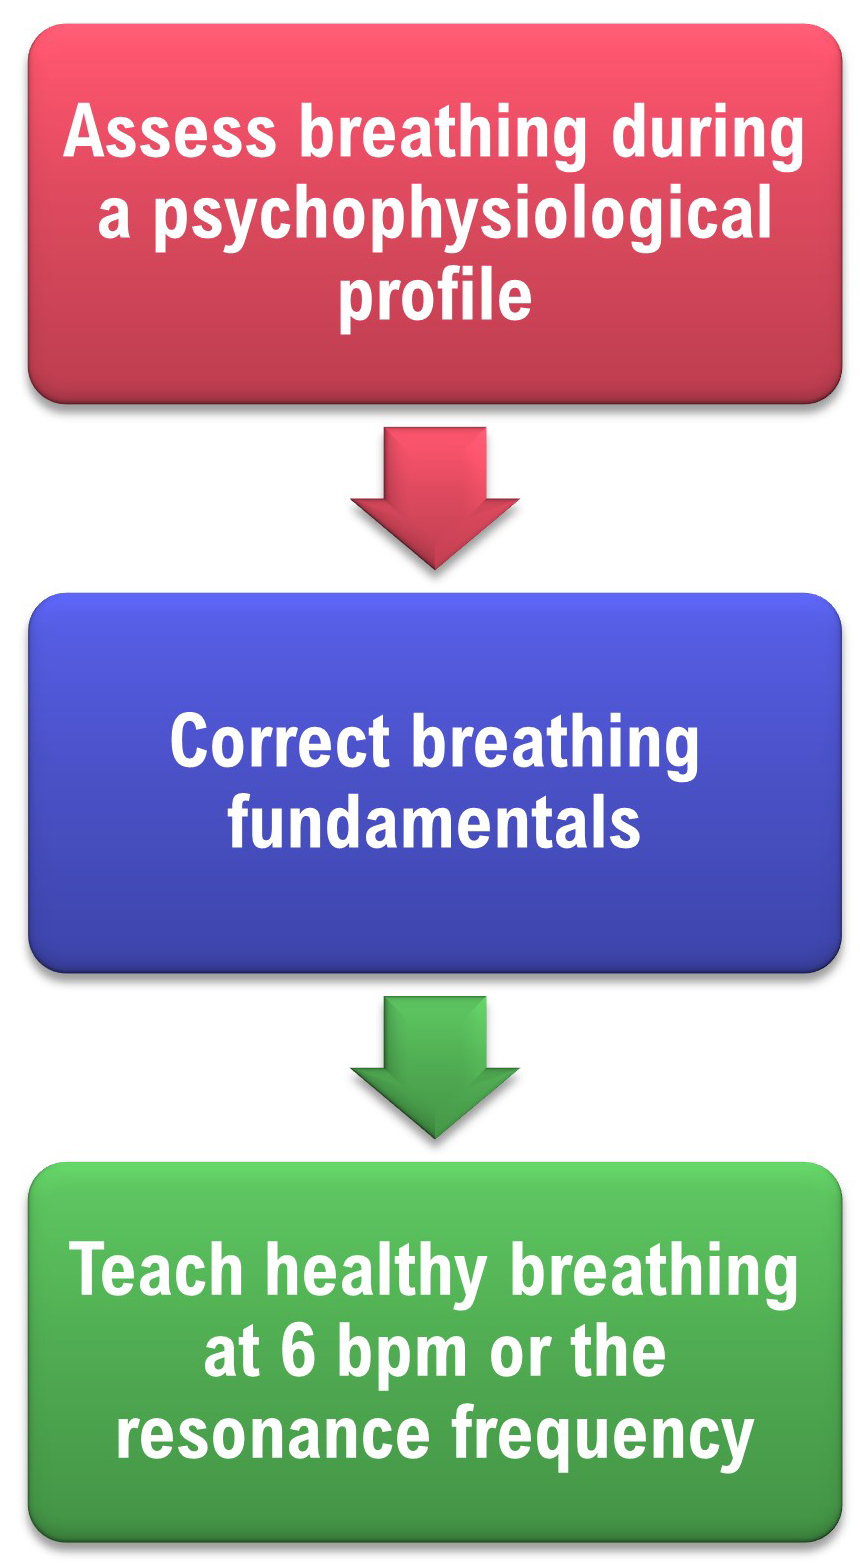
If we don’t correct dysfunctional breathing patterns like overbreathing, they could compromise the effectiveness of HRVB training.

For example, overbreathing is associated with RRs far above the RF range of 4.5-7.5 bpm. Also, breathing is irregular--not sinusoidal. Together, these characteristics preclude strong resonance effects.
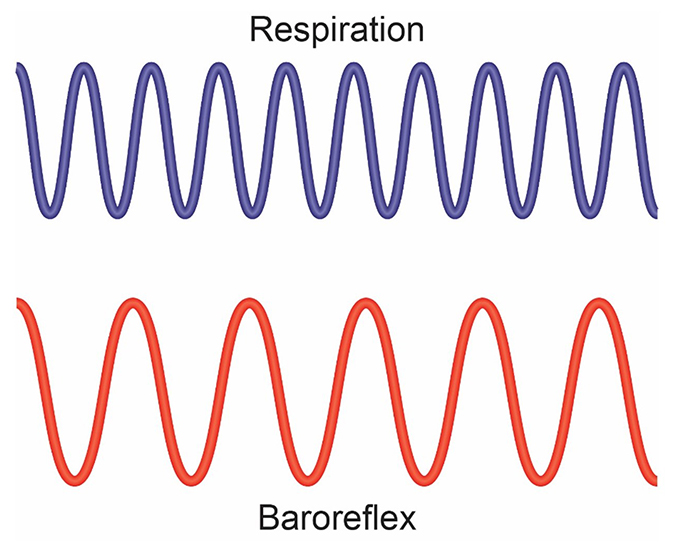
Before HRVB, respiration and the baroreflex are usually out of phase resulting in weak resonance effects. Graphic adapted from Elite Academy.
Listen to a mini-lecture on RF Breathing © BioSource Software LLC.
HRVB training slows breathing to the baroreflex’s rhythm aligning these processes and significantly increasing resonance effects. Graphic adapted from Elite Academy.
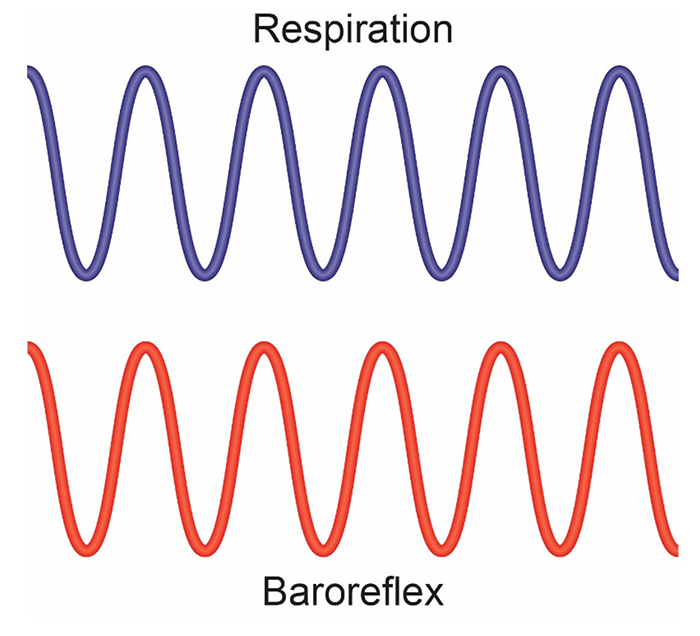
Slowing breathing to rates between 4.5-6.5 bpm for adults and 6.5-9.5 bpm for children increases RSA (Lehrer & Gevirtz, 2014). Graphic adapted from Elite Academy.
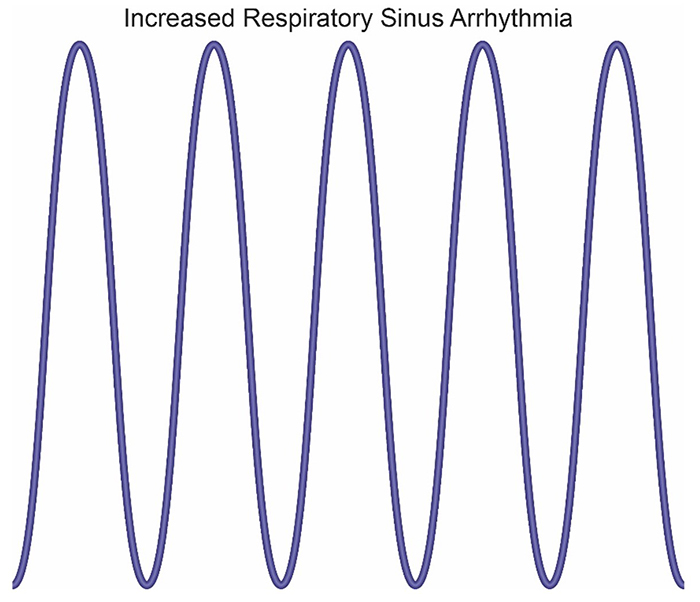
Increased RSA immediately “exercises” the baroreflex without changing vagal tone or tightening BP regulation. Those changes require weeks of practice. HRVB can increase RSA 4-10 times compared to resting (Lehrer et al., 2020b; Vaschillo et al., 2002).
Listen to a mini-lecture on Increased RSA © BioSource Software LLC. Graphic adapted from Gevirtz et al., 2016).
Caption: The red waveform shows HR oscillations while resting without breathing instructions or feedback. The blue waveform shows HR oscillations with HRV biofeedback and breathing from 4.5-6.5 bpm.
Successful clients learn to breathe near their RF and achieve ocean-like breathing cycles without pacing or feedback.
We teach clients to use sound breathing mechanics throughout the day. Slow-paced breathing is appropriate during practice but not during the increased workloads of aerobic exercise. Graphic © goodluz/Shutterstock.com.

Medical Cautions
Clients who overbreathe may experience chronic hypocapnia. Since the body cannot function with sustained high pH, the kidneys excrete bicarbonates to return pH to near-normal levels. Graphic © Alhovic/Shutterstock.com.
Bicarbonates are salts of carbonic acid that contain HC03. Acid buffering can only restore homeostasis in the short run because increased metabolism raises acidity until needed bicarbonates are depleted. When this happens, clients experience fatigue, muscle pain, reduced physical endurance, and a sodium deficit. Acidosis may increase overbreathing in a failed attempt to reduce acidity (Khazan, 2021).
Effortless breathing could be hazardous if your client suffers from diseases that produce metabolic acidoses like diabetes and kidney disease. In these cases, overbreathing is an attempt to compensate for abnormal acid-base balance, and slow-paced breathing could endanger health.
Clients diagnosed with low blood pressure should be careful since slow-paced breathing might further lower blood pressure.
Finally, slow-paced breathing might produce a functional overdose if your client takes anti-hypertensive medication, insulin, or a thyroid supplement. If medication adjustment appears necessary, your client should consult the supervising physician before reducing dosage (Fried & Grimaldi, 1993).

Breathing Basics
Healthy breathing achieves a match between metabolic needs, production of CO2, and breath depth and rate. We should maintain optimal breathing chemistry for each activity level and breathing rate. Although rapid breathing does not always signal overbreathing and slow breathing does not always indicate health, there are correlations (Khazan, 2021). Breathing should be mindful with focus on the abdomen, effortless, between 5-7 breaths per minute, supported by loose clothing, posture, and ergonomics that promote healthy breathing.
Breathe Effortlessly
Encourage your clients to breathe effortlessly (Peper & Tibbets, 1994). Your client should experience their body "breathing itself." Breathing is 5-7 bpm for adults. The pauses following expiration are longer than those following inspiration. Tidal volume is between 1,000 and 3,000 ml. Airflow is smooth and continuous. Their attention settles on the abdomen. The stomach expands, and the lower ribs and back widen during inhalation). Graphic © mimagephotography/Shutterstock.com.
Discourage Deep Breaths
They should breathe at a comfortable depth (like smelling a flower), exhaling longer than inhaling. Breathing will calm your client when its depth and rate satisfy their resting body’s metabolic needs (Khazan, 2021). Elena Sherengovskaya/Shutterstock.com.
Discourage typical deep breathing, where a client inhales a massive breath and inevitably exhales too quickly because this promotes overbreathing and expels too much CO2 (Khazan, 2021).

Breathing will calm your client when its depth and rate satisfy the resting body’s metabolic needs. Don’t encourage deeper or larger breaths. Graphic fizkes © Shutterstock.com.

Encourage Your Clients to Dress for Success
Caution clients to avoid the designer jean syndrome (Peper & Tibbets, 1994) in which tight clothing prevents abdominal expansion and promotes thoracic breathing. Graphic © kbrowne41/Shutterstock.com.Inhale Through the Nostrils
Encourage your clients to inhale through the nostrils to filter, moisten, and warm the air. Depending on training goals and health, they should exhale through the mouth or nose. Graphic © Yuliya Evstratenko/ Shutterstock.com.
Great Posture Promotes Healthy Breathing
“Make sure you choose a comfortable chair that allows you to sit with a straight back, the vertebrae of your spine stacked neatly on top of one another. Your feet should be flat on the floor, legs uncrossed, knees at a 90-degree angle” (Lagos, 2020, p. 58). Clients may also enjoy practicing in natural settings. Graphic © BalanceFormCreative/Shutterstock.com.
Enhance Your Clients' Respiratory Feedback
Teach your clients to exhale using pursed lips as if blowing out a candle (Khazan, 2021). Graphic © JPRFPhotos/Shutterstock.com.
Invite clients to breathe with a weight on the abdomen while lying on the floor with knees bent.

Alternatively, they can place their hands on their abdomens. Graphic stockfour/Shutterstock.com.

Physiological Effects of Healthy Breathing
Hemoglobin molecules on red blood cells transport oxygen and nitric oxide through the bloodstream.
Graphic © Designua/Shutterstock.com.
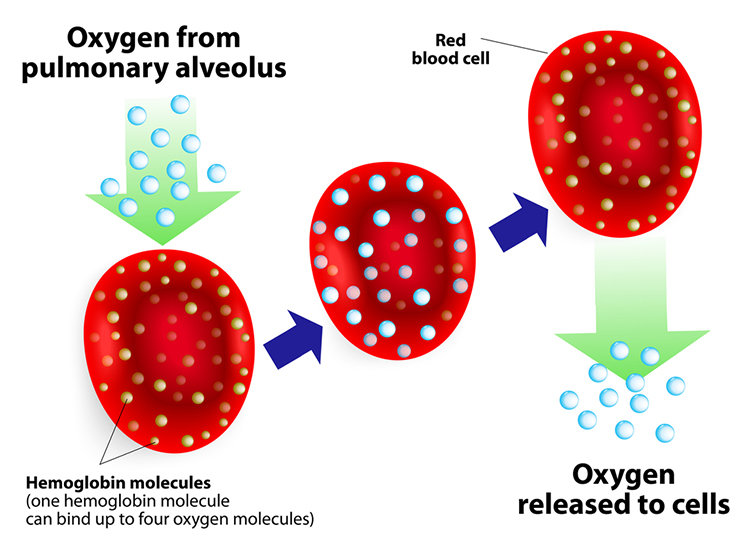
One hemoglobin molecule can carry four oxygen molecules. Red blood cell graphic © royaltystockphoto.com/ Shutterstock.com.
.jpg)
Relaxed Breathing
Relaxed breathing increases the carbon dioxide concentration of arterial blood compared to thoracic breathing. At rest, we only excrete 12-15% of blood CO2. Conserving CO2 lowers blood pH, weakens the bond between hemoglobin and oxygen, and increases oxygen delivery to body tissues. This phenomenon is called the Bohr effect. Check out MEDCRAMvideos YouTube lecture Oxygen Hemoglobin Dissociation Curve Explained Clearly! The breathing chemistry graphics were adapted from Inna Khazan.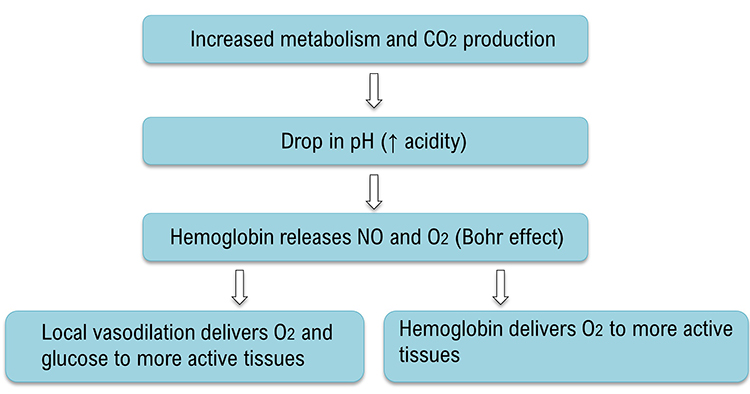
Overbreathing
Conversely, low CO2 levels due to overbreathing or hyperventilation raise blood pH and reduce oxygen delivery to body tissues since oxygen remains tightly bound to the hemoglobin molecules (Fox & Rompolski, 2022).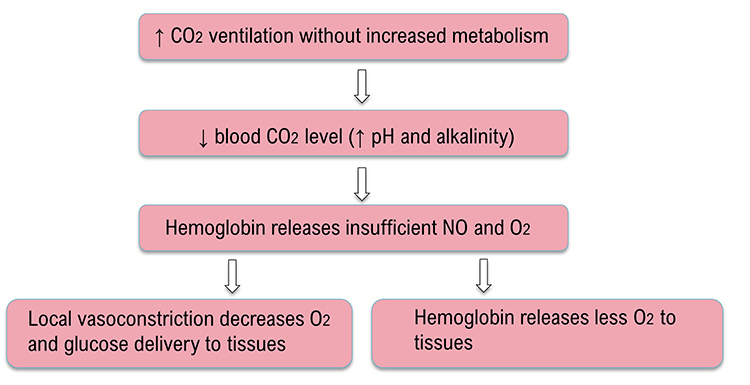
Healthy Breathing
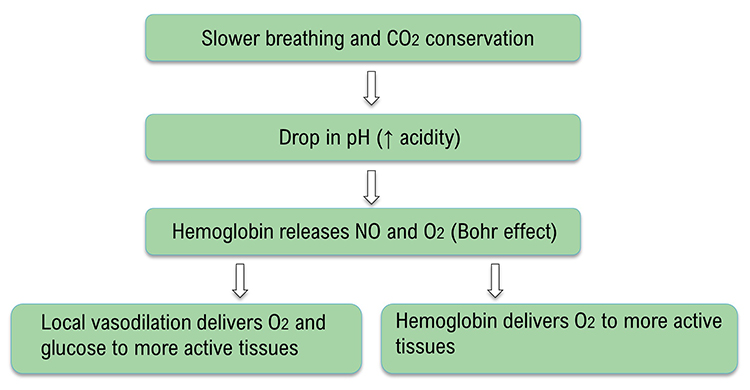
Healthy breathing can increase peripheral blood flow when the RR slows to the resonance frequency (RF) range of 4.6 to 7.5 bpm, and end-tidal CO2 normalizes to 5% or 36 mmHg. Peripheral vasodilation can increase perfusion and delivery of oxygen and glucose to the brain, reduce peripheral resistance, and promote hand-warming. These changes are crucial for executive functioning and treating hypertension, vascular headache, and Raynaud's disease. Breathing in the RF range can slow HR and increase vagal tone and HRV.
Biofeedback Modalities for Teaching Healthy Breathing
The critical modalities for teaching healthy breathing include respirometer biofeedback, accessory muscle SEMG biofeedback, capnographic (end-tidal CO2) biofeedback, and oximetric (oxygen saturation) biofeedback.
Respirometer Biofeedback
Use a respirometer display to shape your client's RR toward their training goal gradually (e.g., 6 bpm or their RF). Graphic © Association for Applied Psychophysiology and Biofeedback.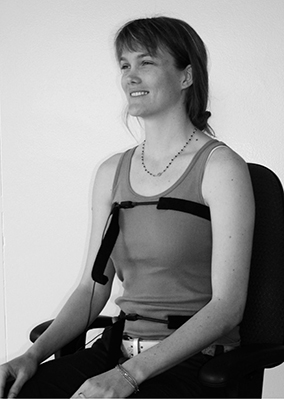
The HR and breathing waveforms should be synchronous. The phase difference should approach 0 degrees. You can estimate the degree of synchrony by observing heart rate change with respect to the breathing cycle: 0 degrees = the peaks and valleys are perfectly aligned, 180 degrees = heart rate increases during exhalation and decreases during inhalation, and 90 degrees = heart rate increases mid-inhalation and decreases mid-exhalation (Lehrer et al., 2013).
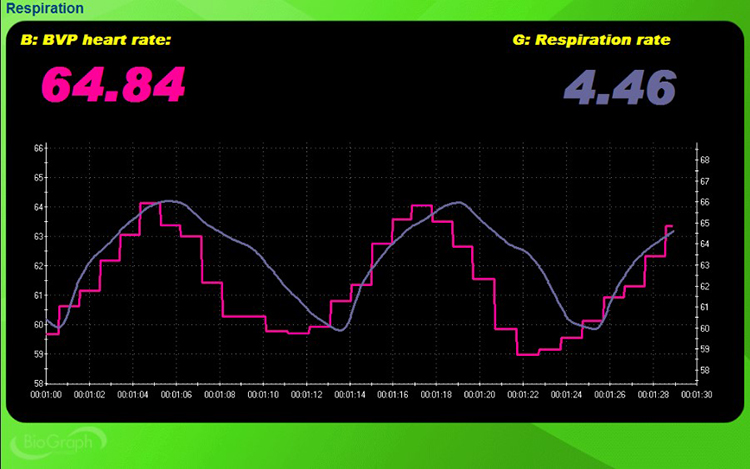
The mean RR is 4.46 on the screen below, both waveforms are sinusoidal with high amplitude and nearly in-phase (their peaks and valleys almost coincide).
Accessory Muscle SEMG Biofeedback
Down-train accessory SEMG to values below 2 microvolts. This benchmark will vary with equipment, settings, placement, posture, and amount of adipose tissue.
Capnometric Biofeedback
Train end-tidal CO2 to values between 35 and 45 torr (5% -6%). Values below 33 torr may indicate overbreathing, and those above 45 torr can be caused by hypoventilation.A capnometer monitors end-tidal CO2, the percentage of CO2 in exhaled air at the end of exhalation.
A capnometer draws exhaled air into its gas composition analysis unit to calculate the percentage of CO2 in each sample. Graphic © Inna Khazan.
Oximetric Biofeedback
A pulse oximeter utilizes a photoplethysmograph (PPG) sensor to measure blood oxygen saturation from a finger or earlobe. Oximeters compare the ratio of red and blue wavelengths in the blood to measure hemoglobin oxygen transport. During overbreathing, oxygen saturation (PaO2) may approach 100%. PaO2 values over 98% signal that less O2 and nitric oxide are available for body tissues (Gilbert, 2019). Train clients to achieve oxygen saturation values between 95% and 98%. A MindMedia oximetry sensor is shown below.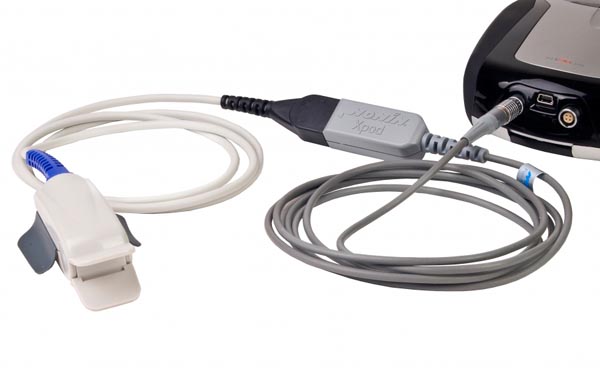
Healthy Breathing Training
You can teach healthy breathing as a component of weekly HRVB training sessions. Provide three or more 3-minute segments (some without feedback and pacing), each followed by coaching. Don’t progress to HRVB until your client has corrected dysfunctional breathing.
The red heart rate and blue respirometer tracings are synchronous with an almost 0-degree phase relationship in the screen below.
Mindful Breathing Awareness
Use earplugs or your fingers to increase breath awareness. Experience each breath without struggle.
Tune in to the sensations that accompany inhalation and exhalation. Allow your body to shift from exhalation to exhalation without rushing this process. Experience difficult emotions, images, sensations, and thoughts that may arise without judgment (Khazan, 2021). Graphic © STUDIO GRAND WEB/Shutterstock.com.
Low-and-Slow Breathing
Robert Fried (1987) recommends shifting breathing to the abdomen and slowing its rate. Clients should take normal-sized inhalations and not emphasize breath depth or volume. They should exhale slowly through the nostrils or pursed lips.Encourage clients to wear nonrestrictive clothing, loosen their clothing to allow the diaphragm to move freely, and assume a comfortable position like reclining. Invite them to place one hand on the abdomen and the other on the chest for feedback (Khazan, 2021).
Some clients may find the image of a balloon helpful in shifting from thoracic to abdominal breathing and remembering when the stomach should expand and contract.
Inhale -- the stomach expands, inflating the balloon.
Exhale -- the stomach contracts, delating the balloon.
Encourage mindful effortless breathing to prevent larger tidal volumes and faster exhalation that result in overbreathing. Engage passive volition by using words like "allow," "let,", and "permit," and avoiding "correct," "effort," "try," and "work."
Demonstrate low-and-slow breathing and allow clients several minutes practice in your clinic.
Sample Instructions from Inna Khazan
"Let's practice low-and-slow breathing. Allow your breath to shift lower towards your abdomen and to slow down gently . To help guide your breath lower, imagine that there is a balloon in your belly. What color is it? …. Now, with every inhalation, imagine that you are gently inflating the balloon and with every exhalation, you are allowing the balloon to deflate.""Do not push your stomach out, do not pull it back in. In fact, do not apply any effort at all. Provide your body with some guidance, and then let your body breathe for you. This is all about letting your breathing happen as opposed to making it happen."
"Keep in mind that your body knows exactly how to breathe low and slow. When you were a baby and a young child, you were breathing this way all the time. You have a few years of practice. This is kind of like riding a bike; you don’t forget how to do it. You just need to let your body do what it knows how to do. Watch me doing this first, and then join in whenever you are ready.”
"Let’s shift the breath down from the chest to the belly, take a normal-sized comfortable breath in, and exhale slowly, perhaps blowing air out through pursed lips, as if you are blowing out a candle. Allow yourself to exhale fully, do not rush the next inhalation Again, take a normal-sized comfortable breath in, exhale slowly and fully." Repeat for 5 or 6 breaths (Khazan, 2021).
Help Clients Recover Their Breathing Reflex
The Breathing Reflex
The breathing reflex is a physiological drive to inhale in response to rising CO2 levels. Clients may override the breathing reflex during overbreathing. They inhale too early before CO2 levels rise to the level that triggers the next breath, lowering blood CO2 levels. This “hijacking” of the breathing reflex may represent an attempt to catch one’s breath due to fear of insufficient oxygen or to reduce anxiety (Khazan, 2021).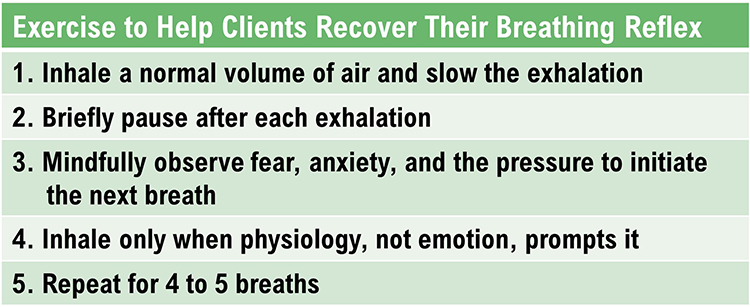
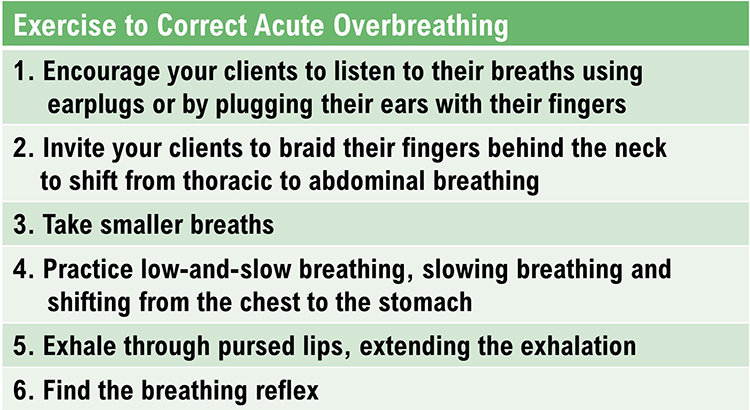
Help Clients Correct Acute Overbreathing
Clients who overbreathe are often unaware of their breathing patterns. We need to teach them to “tune in” to their breathing. They may breathe thoracically and overuse their external intercostal muscles during inhalation. Graphic © McGraw-Hill/Shutterstock.com.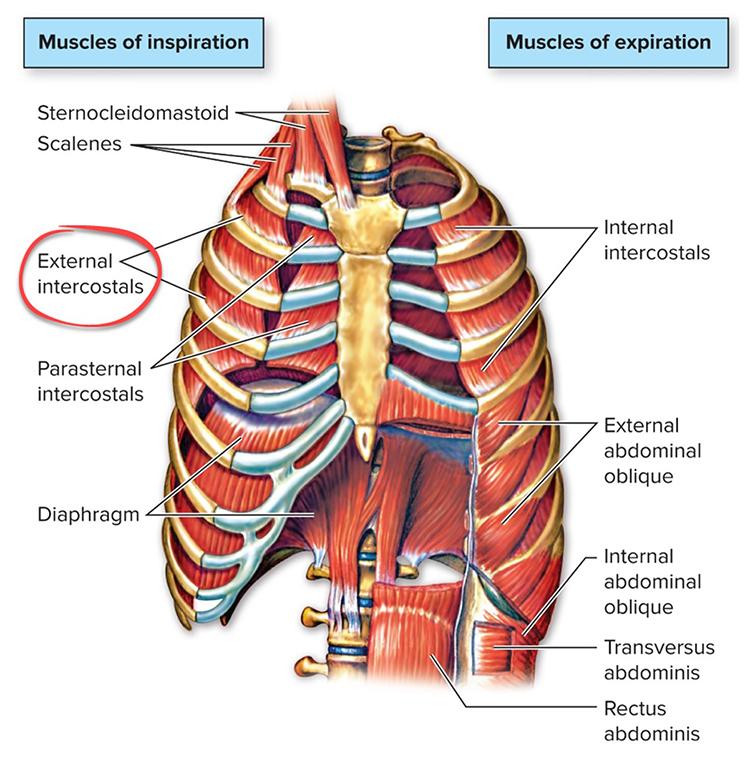
When clients overbreathe, it is vital to help them shift to abdominal breathing so that the dome-shaped diaphragm may descend more completely (Khazan, 2021). Graphic © XiXinXing/Shutterstock.com.
.jpg)
Panic -- When Overbreathing is Severe
When a client has difficulty catching their breath, this may trigger panic. Reassure your client and invite them to hold their breath for 5-20 seconds until the sensations of overbreathing lessen. Monitor their breathing to ensure their practice of low-and-slow breathing with extended exhalations so they do not overbreathe and start another panic cycle (Khazan, 2021). Graphic © Antonio Guillem/Shutterstock.com.
Troubleshooting
Dizziness or Shortness of Breath
These symptoms are often signs of overbreathing. Invite the client to slow their breathing, especially the start of the exhalation, and to lengthen the exhalation. Graphic © Twinsterphoto/Shutterstock.com.
Anxiety or Other Discomfort
Effortful breathing may activate their sympathetic nervous system. Invite the client to switch from "trying to breathe" to "allowing the breath to happen." Graphic © fizkes/Shutterstock.com.
Breathing is Not Relaxing
Reassure the client that this is normal. Explain that the purpose of breathing is restoring healthy breathing chemistry and not relaxing (Khazan, 2021). Graphic © vectorlab2D/Shutterstock.com.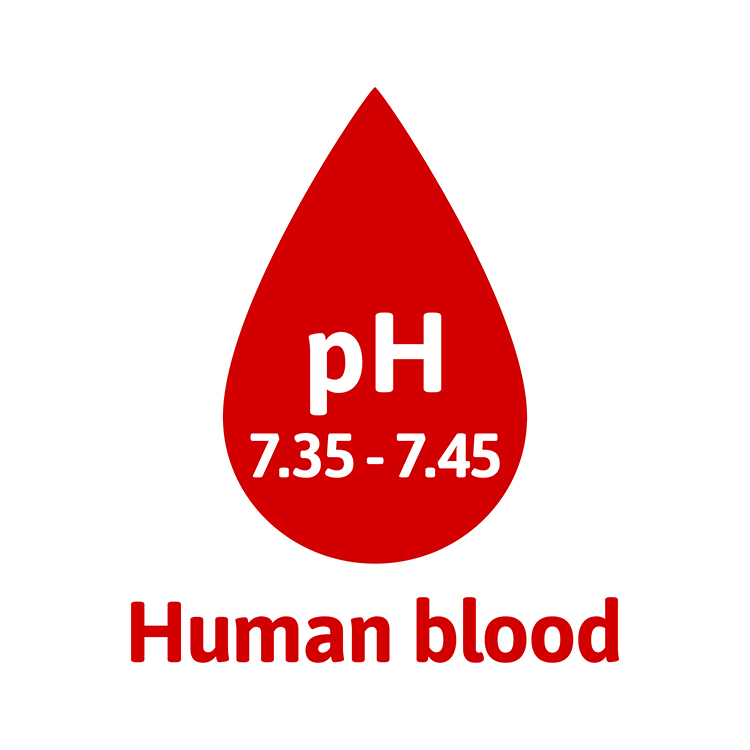
Monitor and Reduce Excessive Breathing Effort
Several "red flags" can signal effortful breathing. First, accessory muscle (e.g., trapezius and scalene) SEMG increases. A trapezius-scalene placement is sensitive to breathing effort.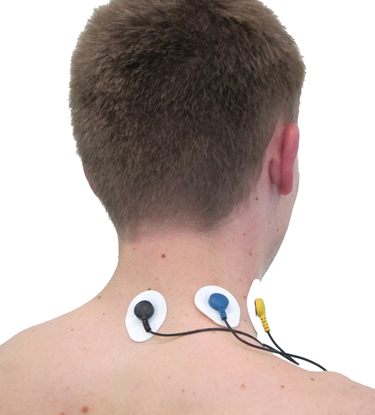
An accessory muscle training screen used to correct clavicular breathing is shown below.
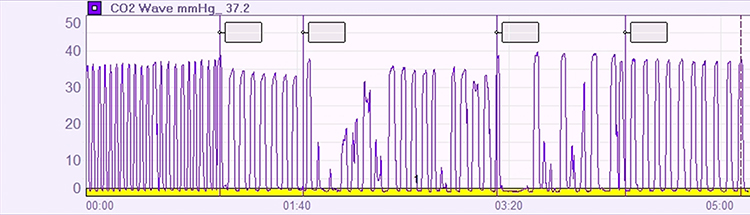
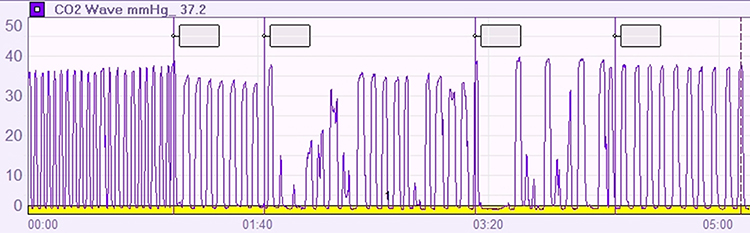
Second, end-tidal CO2 often declines with effort. A capnometer can show whether values fall below 36 mmHg. See the segment from 01:40 to 03:20. Graphic © Inna Khazan.
Third, the respirometer waveform may lose its smoothness when clients try harder.

Breathing Practice
Breathing practice can help generalize breathing skills to everyday life. Clients may benefit from breathing apps and pacers. Encourage them to practice an exercise 20 minutes twice a day, log the activity, and discuss it at the start of the next training session. Also, encourage mindful low-and-slow breathing. Invite your client to observe their breathing several times a day in different settings. When they find themselves overbreathing, they can remind themselves to breathe with less effort.
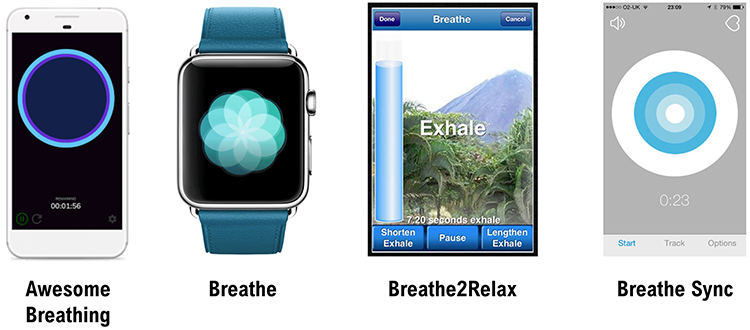
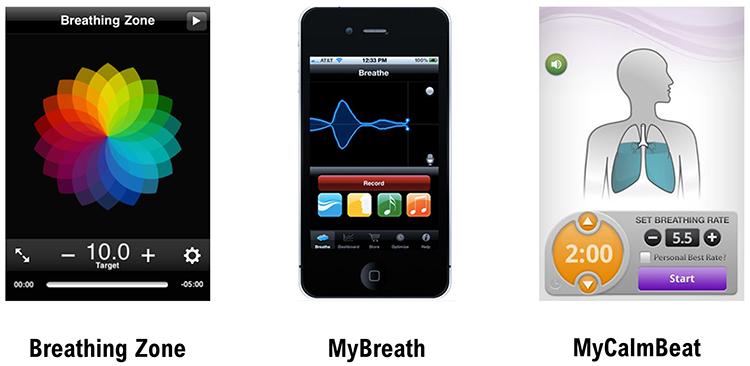
Encourage Practice with Breathing Apps
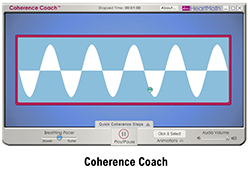
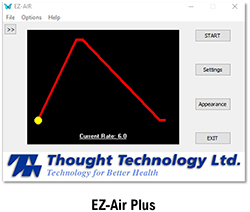
You may use a computer, pad, and smartphone apps that provide auditory or visual pacing. Try them out to find the apps that offer the adjustability and ease of use best for your clients.Consider Coherence Coach and EZ-Air Plus for computers.
 |
 |
Popular apps are available for both Android and Apple platforms.
Encourage Practice with Breathing Pacers
Assign practice with breathing pacers and then gradually fade them. Click on the Alliant link to download these free tracks.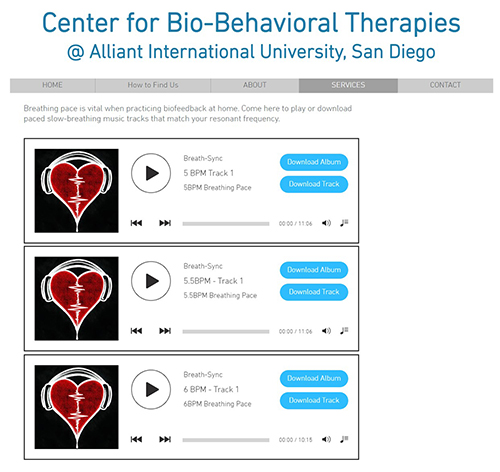
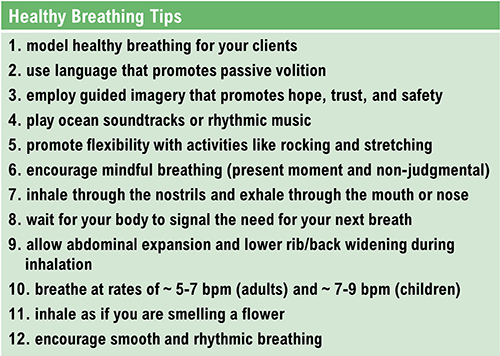
Healthy Breathing Tips
Erik Peper (1994) and Inna Khazan (2021) have proposed several invaluable breathing suggestions. |
 |
The display below shows healthy inhalation and exhalation in which the abdomen gradually expands and then contracts.
The training screen below was designed to teach effortless breathing. The balloon's inflation and deflation mirror the respiration sensor's rhythmic expansion and contraction.
Mary's client wants to breathe deeply during her HRV biofeedback training since she's read that this breathing pattern is healthy. How should Mary respond?
Mary could explain that deep breathing will reduce her HRV. She might invite her client to perform a simple experiment where she observes the peak-to-trough difference in heart rate during both breathing patterns. Deep breathing will produce a smaller difference than healthy breathing.
Glossary
accessory muscles: the sternocleidomastoid, pectoralis minor, scalene, and trapezius muscles, which are used during forceful breathing, as well as during clavicular and thoracic breathing.
apnea: breath suspension.
bicarbonates: the salts of carbonic acid that contain HC03.
capnometer: an instrument that monitors the carbon dioxide (CO2) concentration in an air sample (end-tidal CO2) by measuring the absorption of infrared light.
clavicular breathing: a breathing pattern that primarily relies on the external intercostals and the accessory muscles to inflate the lungs, resulting in a more rapid RR, excessive energy consumption, and incomplete ventilation of the lungs.
diaphragm: the dome-shaped muscle whose contraction enlarges the vertical diameter of the chest cavity and accounts for about 75% of air movement into the lungs during relaxed breathing.
effortless breathing: Erik Peper’s relaxed breathing method in which the client uses about 70% of maximum effort, attention settles below the waist, and the volume of air moving through the lungs increases. The subjective experience is that "my body breathes itself."
end-tidal CO2: the percentage of CO2 in exhaled air at the end of exhalation.
hyperventilation syndrome (HVS): a respiratory disorder that has been increasingly reconceptualized as a behavioral breathlessness syndrome in which hyperventilation is the consequence and not the cause of the disorder. The traditional model that hyperventilation results in reduced arterial CO2 levels has been challenged by the finding that many HVS patients have normal arterial CO2 levels during attacks.
metabolic acidosis: a pH imbalance in which the body has accumulated excessive acid and has insufficient bicarbonate to neutralize its effects. In diabetes and kidney disease, hyperventilation attempts to compensate for abnormal acid-base balance, and slower breathing could endanger health.
overbreathing: subtle breathing behaviors like sighs and yawns reduce end-tidal CO2 below 5%, exceeding the body's need to eliminate CO2.
pulse oximeter: a device that measures dissolved oxygen in the bloodstream using a photoplethysmograph sensor placed against a finger or earlobe.
respiratory amplitude: the excursion of an abdominal strain gauge.
resonance frequency (RF): the frequency at which a system, like the cardiovascular system, can be activated or stimulated.
reverse breathing: the abdomen expands during exhalation and contracts during inhalation, often resulting in incomplete ventilation of the lungs.
thoracic breathing: a breathing pattern that primarily relies on the external intercostals to inflate the lungs, resulting in a more rapid RR, excessive energy consumption, and insufficient ventilation of the lungs.
torr: the unit of atmospheric pressure, named after Torricelli, which equals 1 millimeter of mercury (mmHg) and is used to measure end-tidal CO2.
trapezius-scalene placement: active SEMG electrodes are located on the upper trapezius and scalene muscles to measure respiratory effort.
REVIEW FLASHCARDS ON QUIZLET
Click on the Quizlet logo to review our chapter flashcards.
Assignment
The screens below show breathing with a hand on the abdomen and then a book. Which produced the best results? Why?
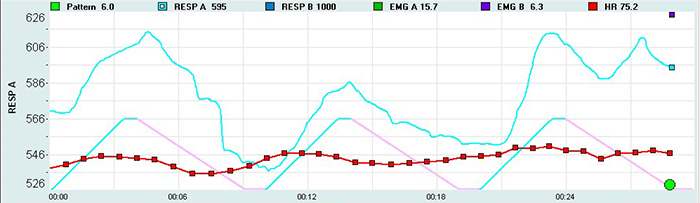
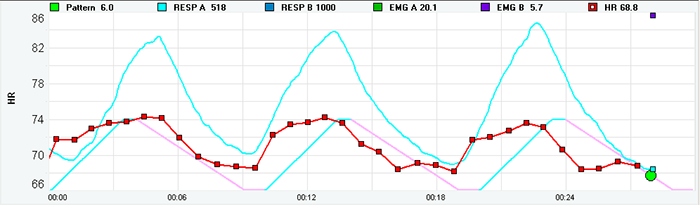
Inspect the blue respirometer tracings. The bottom tracing is more sinusoidal. Examine the red heart rate tracings. The bottom tracing is also more sinusoidal. Finally, check for synchrony. The bottom tracing shows closer alignment of the peaks and valleys for both signals. For this client, the book on abdomen method was more effective.
Which breathing problem is illustrated by the screen below? How did this problem affect the distribution of HRV power?
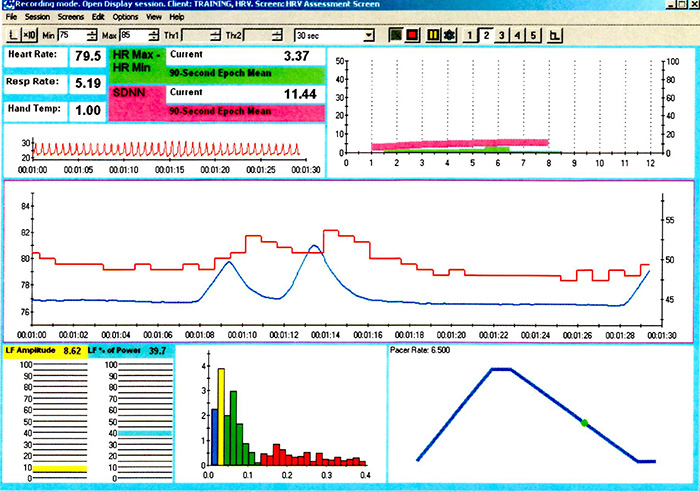
The 12-second pause after the second breath is consistent with apnea. Note the low LF amplitude and dominant frequency in the VLF range due to the disordered breathing. Finally, observe the absence of a sinusoidal waveform in the red heart rate tracing and the absence of synchrony between both the heart rate and respirometer signals.
These recordings are from chronic pain patients who received treatment in an interdisciplinary chronic pain program.
References
Bax, A., Robinson, T., & Goedde, J. (2007). The Cousins relaxation exercise increases heart rate variability [Abstract]. Applied Psychophysiology and Biofeedback, 32(1), 52.
Fried, R. (1987). The hyperventilation syndrome: Research and clinical treatment. John Hopkins University Press.
Fried, R., & Grimaldi, J. (1993). The psychology and physiology of breathing. Springer.
Gevirtz, R. N. (2005). Heart rate variability biofeedback in clinical practice. AAPB Fall workshop.
Gilbert, C. (2012). Pulse oximetry and breathing training. Biofeedback, 40(4), 137-141. https://doi.org/10.5298/1081-5937-40.4.04
Gilbert, C. (2019). A guide to monitoring respiration. Biofeedback, 47(1), 6-11. https://doi.org/10.5298/1081-5937-47.1.02
Kabins, A., Goedde, J., Layne, B., & Grant, J. (2008). Brief coaching increases inhalation volume [Abstract]. Applied Psychophysiology and Biofeedback, 33(3), 174.
Khazan, I. (2019). Biofeedback and mindfulness in everyday life: Practical solutions for improving your health and performance. W. W. Norton & Company.
Khazan, I. (2021). Respiratory anatomy and physiology. BCIA HRV Biofeedback Certificate of Completion Didactice workshop.
Khazan, I. Z. (2013). The clinical handbook of biofeedback: A step-by-step guide for training and practice with mindfulness. John Wiley & Sons, Ltd.
Lehrer, P., Vaschillo, B., Zucker, T., Graves, J., Katsamanis, M., Aviles, M., & Wamboldt, F. (2013). Protocol for heart rate variability biofeedback training. Biofeedback, 41(3), 98-109. https://doi.org/10.5298/1081-5937-41.3.08
Peper, E., Gibney, K. H., & Holt, C. F. (2002). Make health happen: Training yourself to create wellness (2nd ed.). Kendall Hunt Publishing Company.
Peper, E., Gibney, K. H., Tylova, H., Harvey, R., & Combatalade, D. (2008). Biofeedback mastery: An experiential teaching and self-training manual. Association for Applied Psychophysiology and Biofeedback.
Shaffer, F., Bergman, S., & Dougherty, J. (1998). End-tidal CO2 is the best Indicator of breathing effort [Abstract]. Applied Psychophysiology and Biofeedback, 23(2).
Shaffer, F., Bergman, S., & White, K. (1997). Indicators of diaphragmatic breathing effort [Abstract]. Applied Psychophysiology and Biofeedback, 22(2), 145.
Shaffer, F., Greve, E., & Reinagel, K. (1996). Predictors of inhalation volume [Abstract]. Biofeedback and Self-Regulation, 21(4), 352.
Shaffer, F., Mayhew, J., Bergman, S., Dougherty, J., & Irwin, D. (1999). Designer jeans increase breathing effort [Abstract]. Applied Psychophysiology and Biofeedback, 24(2), 124-125.
Shaffer, F., & Moss, D. (2006). Biofeedback. In Y. Chun-Su, E. J. Bieber, & B. Bauer (Eds.). Textbook of complementary and alternative medicine (2nd ed.). Informa Healthcare.
Vaschillo, E., Lehrer, P., Rishe, N., & Konstantinov, M. (2002). Heart rate variability biofeedback as a method for assessing baroreflex function: A preliminary study of resonance in the cardiovascular system. Applied Psychophysiology and Biofeedback, 27, 1-27. https://doi.org/10.1023/a:1014587304314
Zerr, C., Kane, A., Vodopest, T., Allen, J., Hannan, J., Fabbri, M., . . . Shaffer, F. (2015).
Does inhalation-to-exhalation ratio matter in heart rate variability biofeedback? [Abstract]. Applied Psychophysiology and Biofeedback, 40(2), 135. https://doi.org/10.1007/s10484‐015‐9282‐0
Zerr, C., Kane, A., Vodopest, T., Allen, J., Fabbri, M., Williams, C., . . . Shaffer, F. (2015). Does inhalation-to-exhalation ratio matter in heart rate variability biofeedback? [Abstract]. Applied Psychophysiology and Biofeedback, 40(2), 135. doi:10.1007/s10484-015-9282-0
D. HRV TRAINING
Heart rate variability biofeedback (HRVB) aims to exercise the baroreceptor reflex and the vascular tone rhythm to enhance homeostatic regulation, regulatory reserve, and executive functions (Gevirtz, 2021).

Lehrer and colleagues (2000, 2013) have published two descriptions of their HRVB RF protocol that detail their approaches to assessment and training.
Donald Moss asks the deceptively simple question, "Why do we train?" Clinicians who provide HRVB training seek to improve their client's ability to self-regulate, promote health, and enhance their quality of life and performance. Graphic © PRESSLAB/Shutterstock.com.

Core Elements of HRV Biofeedback
The client-practitioner relationship is the foundation of BFT and NFT. HRV biofeedback is most effective when clients and providers are mindful because this promotes self-awareness and a sense of agency. HRV biofeedback promotes self-regulation when a practitioner provides effective coaching (Khazan, 2019).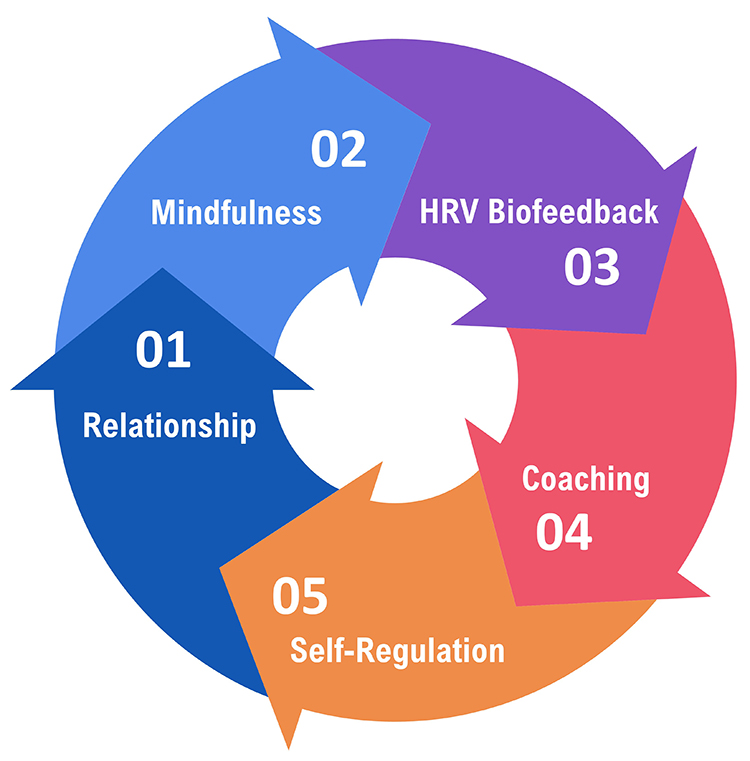
Mindfulness involves "paying attention in a particular way: on purpose, in the present moment, and nonjudgmentally" (Kabat-Zinn, 1994). Graphic © Dirk Ercken/Shutterstock.com.

Mindfulness guides the trial-and-error process underlying self-regulation by helping clients draw connections between their actions, internal feedback, and results. Graphic retrieved from Pinterest.

Clients discover their unique psychophysiological response patterns and learn which strategies help them increase respiratory sinus arrhythmia (RSA) and heart rate variability (HRV). Graphic © Elite HRV.
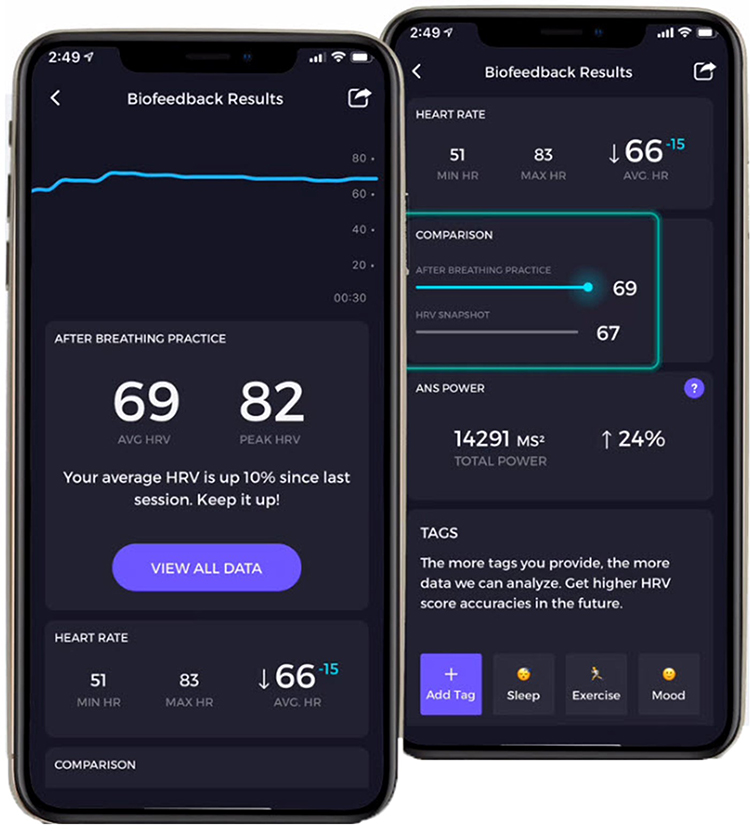
Caption: The Elite HRV app provides feedback during and across sessions to guide self-regulation.
Mindfulness supports emotional self-regulation by teaching resilience, which is the process of adapting effectively to new challenges, stressors, threats, and trauma. Graphic © Rido/Shutterstock.com.
.jpg)
Lief Therapeutic's wearable signals clients with vibrations to enhance their mindfulness of stress triggers in everyday situations. Graphic © Digital Trends.
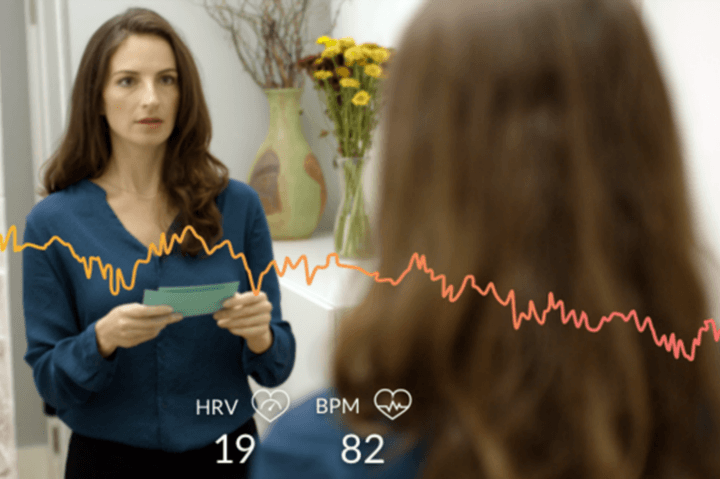
Emotional self-regulation involves the self-monitoring, initiation, maintenance, and modulation of rewarding and challenging emotions and the avoidance and reduction of high levels of negative affect (Bridges, Denham, & Ganiban, 2004). Graphic © F8 studio/Shutterstock.com.

Slow-paced breathing involves healthy breathing near an individual's unique resonance frequency (RF) or 6 breaths per minute (bpm) to exercise the baroreceptor reflex and vascular tone rhythm, increasing vagal tone and HRV.
Mindful low-and-slow breathing can amplify RSA. The graphic below was adapted from Grossman and Kollai (1993). RSA, shown as a change in heart rate from inhalation to exhalation, increases as the respiration rate approaches 6 bpm.
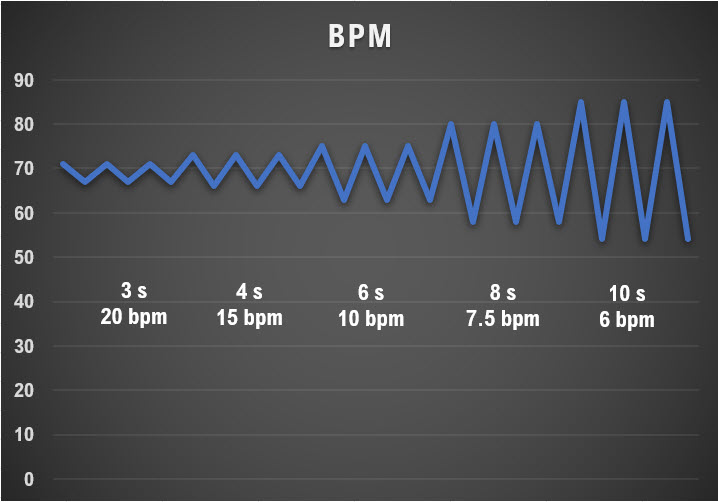
A HRV Biofeedback Koan
While your clients practice slow-paced breathing near their RF, this will increase peak-to-trough heart rate (HR) differences, RMSSD, and low-frequency (LF) power. Following weeks of practice, they should expand their peak-to-trough HR fluctuations, RMSSD, and high-frequency (HF) power when breathing at typical rates without feedback or pacing (Gevirtz, 2021).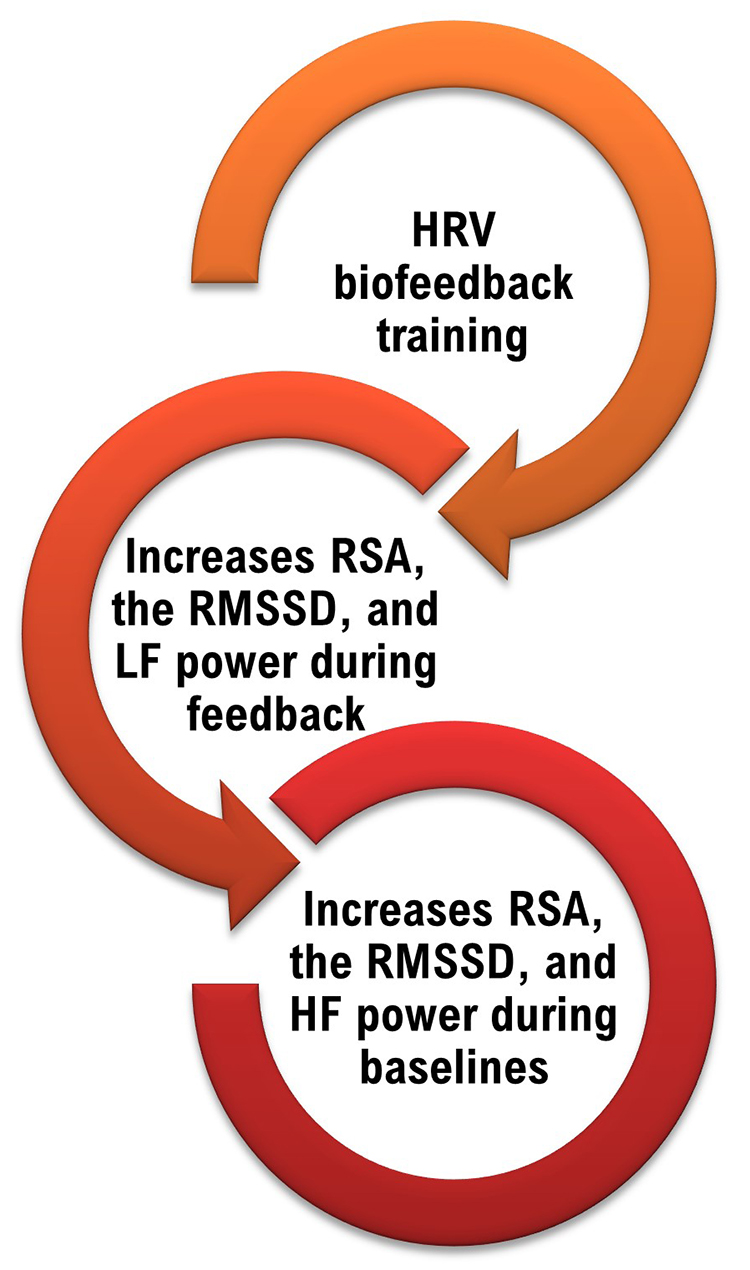
We encourage you to read Lehrer and Gevirtz's (2014) excellent Frontiers in Psychology overview of HRV biofeedback, Heart rate variability: How and why does it work?
This section covers Medical Cautions, Clinical Tips When You Start HRV Biofeedback Training, HRV Biofeedback Training, and Practice Assignments.
Medical Cautions
Clinicians should examine ECG morphology for evidence of arrhythmias, ischemia, and prolonged QT intervals that could jeopardize patient safety (Drew et al., 2004) as part of an assessment preceding HRVB training. Where there is evidence of conduction abnormalities, clinicians should encourage their clients to consult with their physicians. They should proceed with training if the physician considers it appropriate.
Atrial fibrillation is the most common cardiac arrhythmia and involves the rapid, irregular contraction of the two upper atrial chambers.
Ischemia depresses the ST segment of the ECG, which occurs when the lower chambers or ventricles are depolarized. Compare the normal and subendocardial ischemia ST segments. Graphic © logika600/Shutterstock.com.
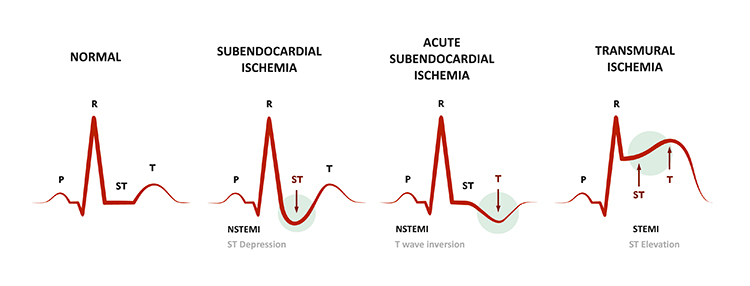 The QT interval signals the depolarization and repolarization of the ventricles. Graphic © Designua/Shutterstock.com.
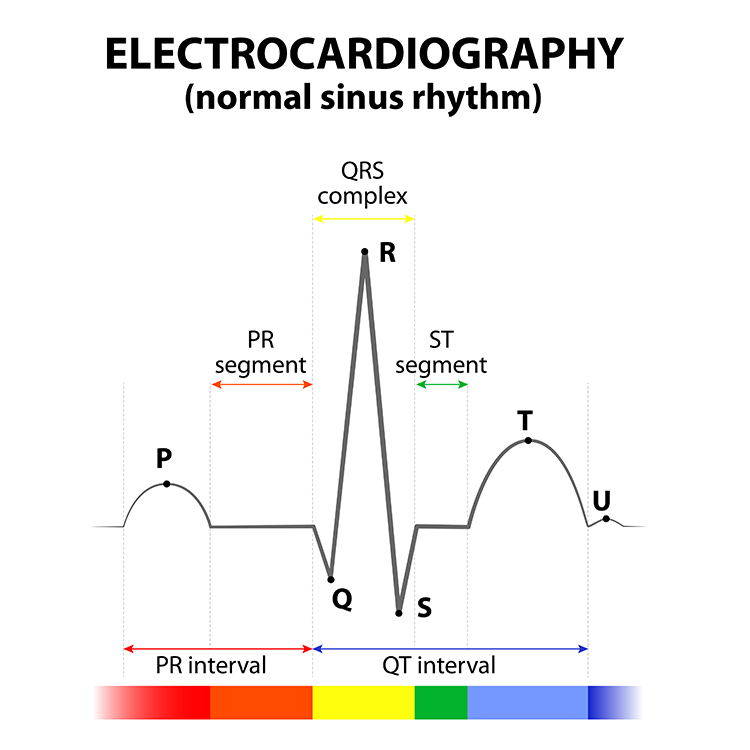
A prolonged QT interval is associated with an increased risk of ventricular tachyarrhythmias, resulting in cardiac arrest and sudden death. Graphic retrieved from Semantic Scholar.
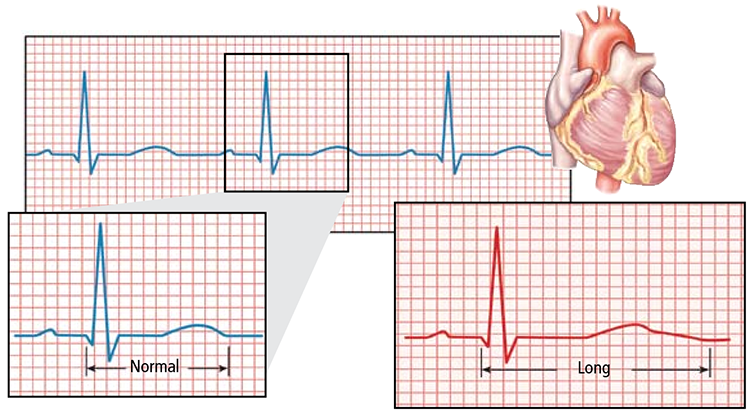
Clinical Tips When You Start HRV Biofeedback Training
Critical elements of HRVB training include modeling, your relationship with your client, passive volition, monitoring HRV, selecting an effective display, teaching rhythmical skeletal muscle tension instead of paced breathing, monitoring excessive effort, engaging games and apps, pacing displays, resting heart rate (HR), and emotional self-regulation.
Modeling
Clinicians are always "on stage." Model low-and-slow breathing and positive emotion throughout each session. Graphic © fizkes/Shutterstock.com.
Relationship
A warm and supportive relationship with your client is the foundation for successful biofeedback training (Taub & School, 1978). From a polyvagal theory perspective, it creates a safe environment where your client can practice alternatives to fight-or-flight, freezing, or parasympathetic withdrawal. Graphic © Monkey Business img/Shutterstock.com.
Passive Volition
Encourage an attitude of passive volition (allowing) and effortlessness (the body feels as if it is breathing itself). A passive attitude is crucial because it avoids sympathetic nervous system (SNS) activation, which reduces vagal tone and overbreathing. Graphic © katalinks/Shutterstock.com.
Monitoring HRV
Consider an ECG sensor on the wrists or a PPG sensor on an earlobe or finger for clinical work. A PPG sensor trades accuracy for ease of application. An ECG sensor may be required if there is significant vasoconstriction due to outdoor temperature or stress, movement, or standing (Constant et al., 1999; Hemon & Phillips, 2016; Jan et al., 2019; Medeiros et al., 2011).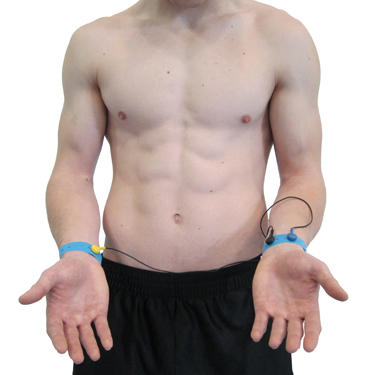
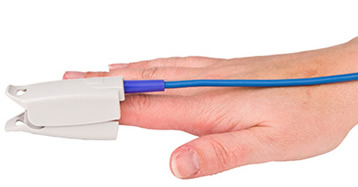
Selecting an Effective Display
Provide an HRV training screen with respirometer and instantaneous HR waveforms. Analog displays can provide your client with incredibly detailed and intuitive information. Encourage your client to increase the peak-to-trough swings in heart rate during each breathing cycle (Lehrer et al., 2013; Lehrer & Gevirtz, 2014).
While client preference and success should guide your selection of feedback displays, you might first try feedback of LF power and peak-to-trough differences.
Low-Frequency Training By Dr. Khazan
Dr. Inna Khazan demonstrates how paced and normal breathing can change low- and high-frequency power © Association for Applied Psychophysiology and Biofeedback. You can enlarge the video by clicking on the bracket icon at the bottom right of the screen. When finished, click on the ESC key.
The concentration of signal power around 0.1 Hz in the LF band corresponds to the Institute of HeartMath's concept of coherence, in which a client produces a "narrow, high-amplitude, easily visualized peak" from 0.09-0.14 Hz (Ginsberg, Berry, & Power, 2010, p. 54; McCraty et al., 2009).
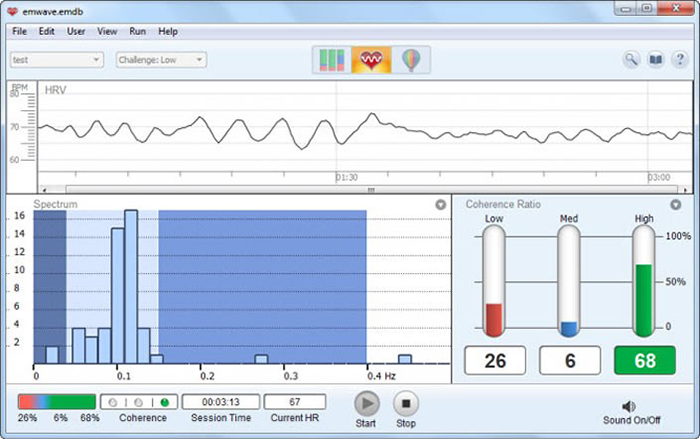
The screen shown below is designed to increase the percentage of power in the LF band. This display shows the dynamic change in the distribution of HRV amplitude as a client breathes effortlessly and cultivates positive emotion.
Some clients may prefer a display of the synchrony (alignment of peaks and troughs) between respirometer and instantaneous HR signals. Synchrony is crucial because it amplifies the resonance effects of slow-paced breathing (Vaschillo et al., 2002). The screen below displays the degree of synchrony between respiration and heart rate. The flower opens as synchrony increases.
Teaching Rhythmical Skeletal Muscle Tension Instead of Paced Breathing
Rhythmical skeletal muscle tension (RSMT) offers an alternative to slow-paced breathing. RSMT may be helpful for clients who breathe dysfunctionally or who cannot slow their breathing to the RF range. Use an ECG chest strap or PPG sensor attached to an earlobe to monitor HRV. While reclining with feet supported by a chair, your clients can rhythmically contract their hands and feet for 3 seconds at their RF to increase heart rate variability (Vaschillo et al., 2011). Graphics © BioSource Software LLC show relaxation and contraction.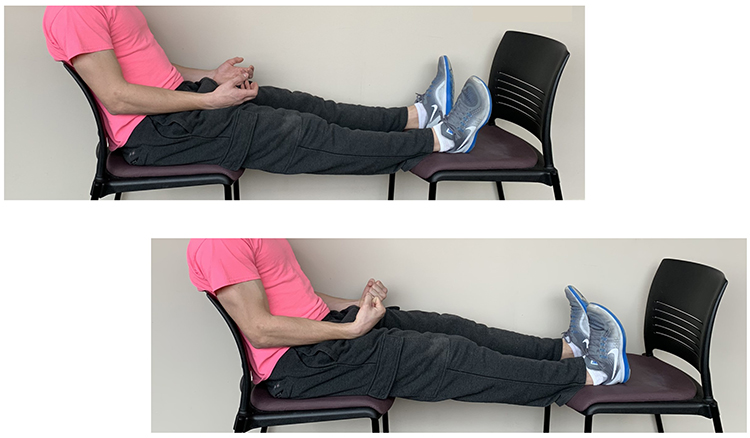
Monitoring Excessive Effort
Excessive effort (active volition) during HRVB training can increase SNS activation, reducing vagal tone, and promote overbreathing. Clinicians can detect effort by monitoring respirometer, HR and HRV, accessory muscle SEMG, and capnometer waveforms.Respirometer
Breathing effort can disrupt a smooth breathing waveform and create inflection points.HR and HRV
If training effort increases SNS tone, HR may increase with very-low-frequency (VLF) band power, and HRV may decrease. This phenomenon is called vagal withdrawal. In the FFT spectral plot, VLF power is colored gray.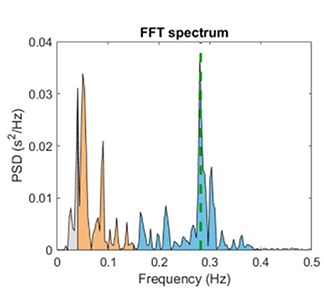
Accessory Muscle SEMG
An electromyograph can monitor the over-use of breathing accessory muscles. These include the sternocleidomastoid, scalenes, pectoralis major and minor, serratus anterior, and latissimus dorsi. A trapezius-scalene placement is shown below. Graphic © BioSource Software LLC.The screen below provides respiratory and SEMG biofeedback to teach rhythmic breathing while maintaining relaxed accessory muscles. Note the overuse of accessory muscles during clavicular breathing.
Capnometer
Excessive breathing effort that expels too much CO2 can decrease end-tidal CO2. Graphic © Inna Khazan. Note the disruption of the capnometer waveform from 3:20 to 5:00.Engaging Games and Apps
Once your client has mastered slow-paced breathing, games can motivate practice and speed skill acquisition. Biofeedback software allows clients to challenge themselves with increasing game difficulty levels without triggering parasympathetic withdrawal. This is crucial for transferring self-regulation skills to everyday life. Zukor's Drive, Zukor's Sport, the Garden Game, and BioGraph Infiniti screens are shown below.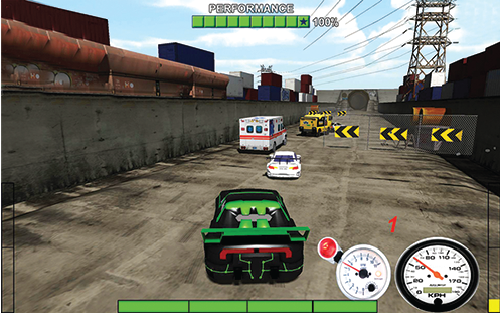 |
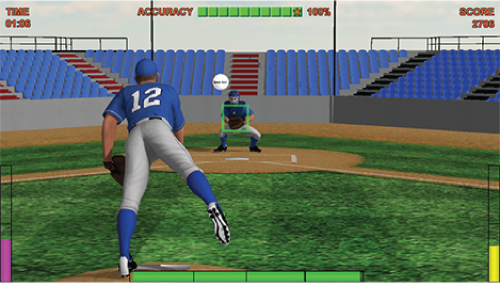 |
 |
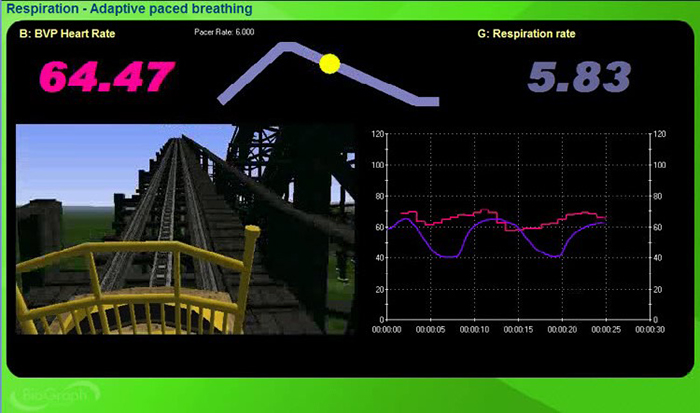 |
Inner Balance, Elite HRV, HRV4 Training, and Camera HRV screens are shown below.
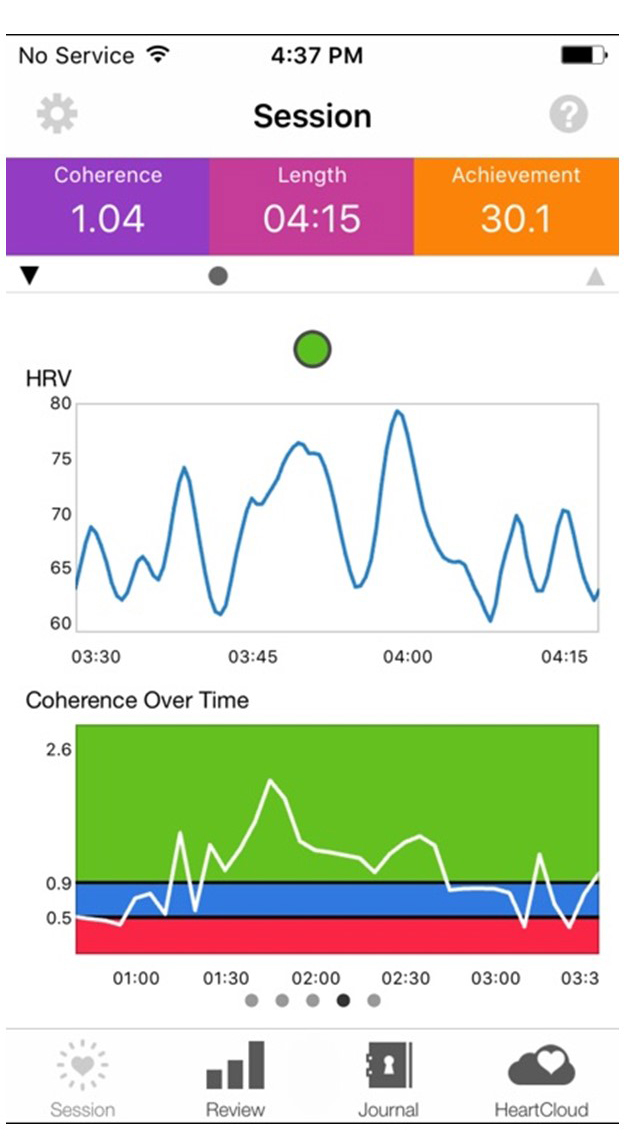 |
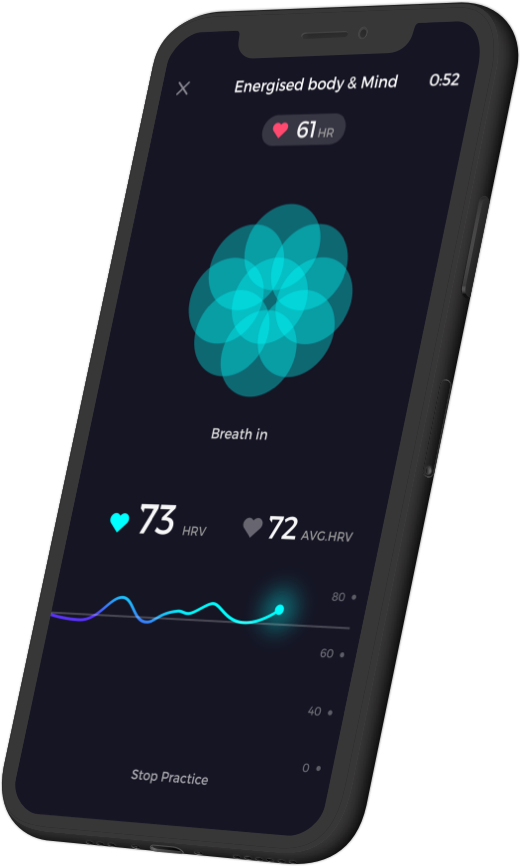 |
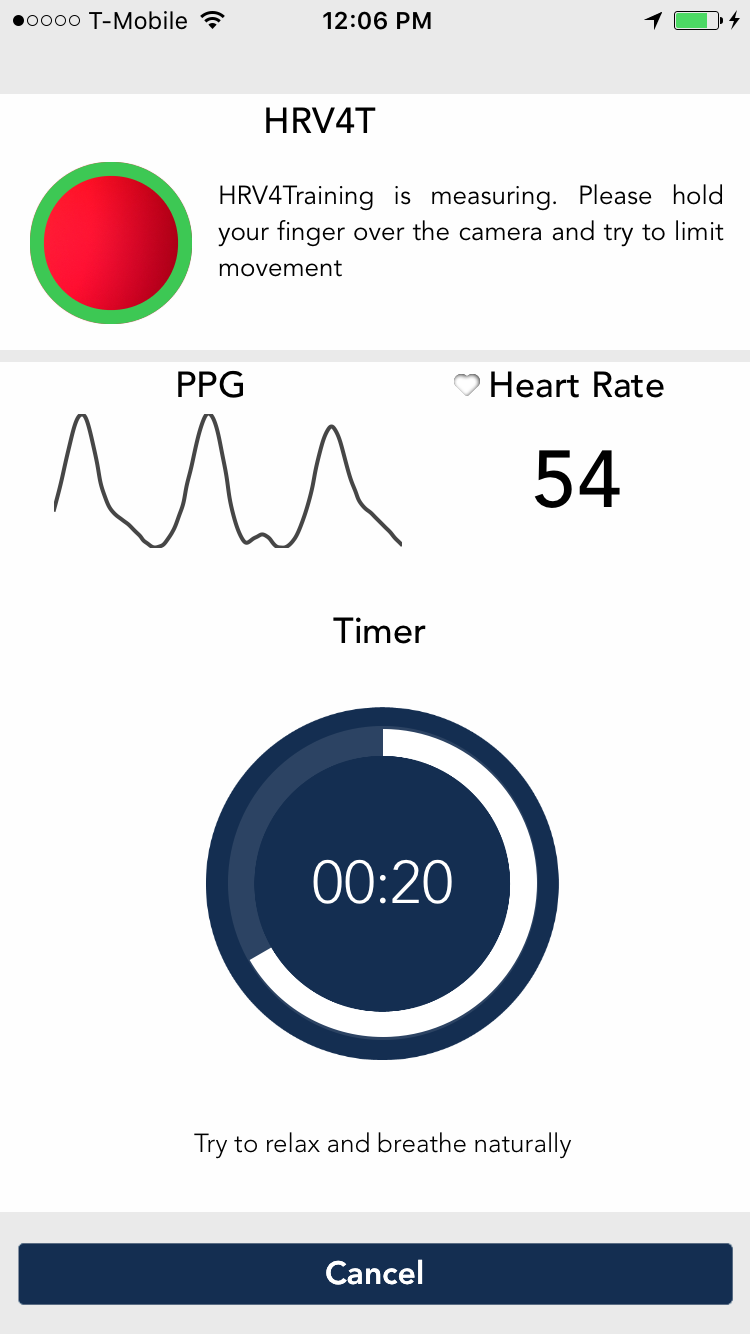 |
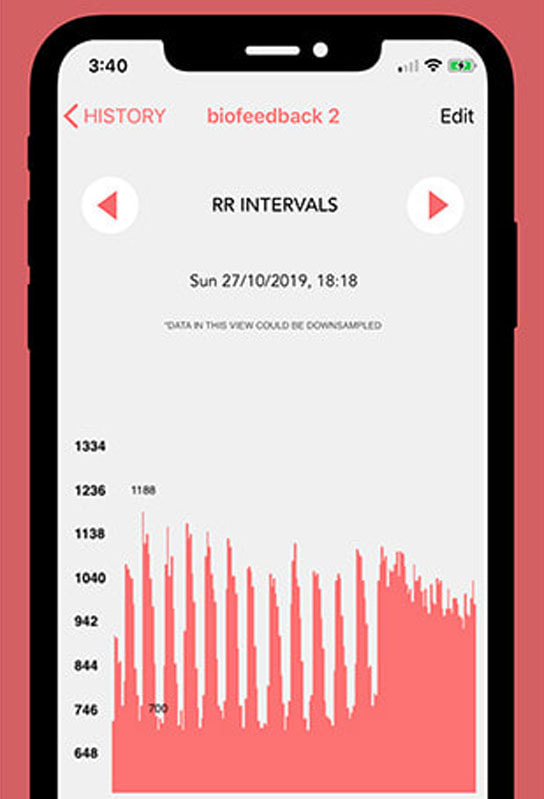 |
Pacing Displays
Pacers can guide breathing and RSMT using animation and sound. Software may integrate a pacer into an HRVB display, or it may be separate. Assign practice with breathing pacers and then gradually fade them.You may use a computer, pad, and smartphone apps that provide auditory or visual pacing. Try them out to find the apps that offer the adjustability and ease of use best for your clients.
Consider Coherence Coach and EZ-Air Plus for computers.
|
|
These apps are available for both Android and Apple platforms.
Auditory Pacing
Click on the Alliant International University link to download for auditory pacing.Stopwatch Pacer
Use a stopwatch app that continuously loops when teaching RSMT instead of slow-paced breathing. For 6 contractions per minute (cpm), select 10 seconds with no pause and instruct your client to contract their hands and feet simultaneously for the first 3 seconds of each cycle.
Resting HR
Elevated resting HRs can limit HRVB training success. Encourage your clients to drink sufficient water. Hypohydration increases HR and reduces HRV (Carter et al., 2005; Watsi & Farquhar, 2019). Graphic © Prostock-studio/Shutterstock.com.
Although caffeine is a central nervous system stimulant, neither acute nor chronic caffeine intake significantly affects HR or HRV in healthy individuals (de Oliveira et al., 2017; Vansickle et al., 2020). Graphic © ifong/Shutterstock.com.

Emotional Self-Regulation
Emotional self-regulation strategies can teach your clients to increase appreciation, heartfelt emotion, and resilience. We will describe the Institute of HeartMath’s Lock-In Technique ® later in this unit. Graphic © pixelheadphoto digitalskillet/Shutterstock.com.
HRV Biofeedback Training
Overview
Clients can increase RSA and HRV time- and frequency-domain measurements during their initial training session. After four 30-minute sessions, many clients correct dysfunctioning breathing and increase vagal tone and HRV. However, they may require extended training and practice (e.g., 10 or more sessions) to achieve maximum health and performance gains (Lagos et al., 2011).This section covers session structure, resting pre- and post-baseline measurements, how to select a starting respiration rate, training introduction, training success indicators, training difficult indicators, training segment review, promote mindful breathing, session review, comparing pre- and post-session values, HRV biofeedback training elements, and how many sessions are required.
Session Structure
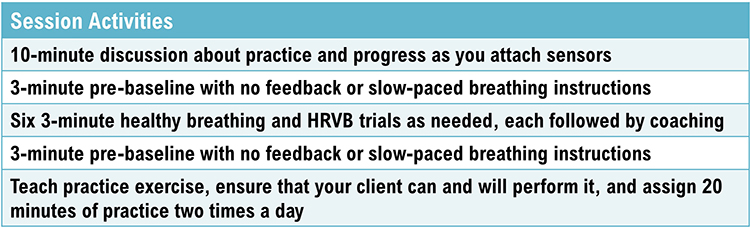
Resting Pre- and Post-Baseline Measurements
Resting baselines measure your clients’ psychophysiological activity without feedback or paced breathing. You might instruct your clients to “sit quietly and breathe normally for the next few minutes.” You might monitor HRV, breathing (depth, pattern, and rate), autonomic activity (skin conductance and temperature), BP, and end-tidal CO2 as appropriate.Compare pre-baseline to post-baseline changes within a session to show within-session learning. Evaluate pre-baseline changes across sessions to see the combined effect of clinic training and home practice.
Since your clients will breathe at typical rates (~12-16 bpm) during pre- and post-baselines, do not expect increases in LF power. Instead, look for increased HF, HRV metrics (e.g., RMSSD), and hand temperature, and reduced skin conductance level.
We train clients to increase LF power during slow-paced breathing to increase HF power during baselines when they breathe at typical rates.
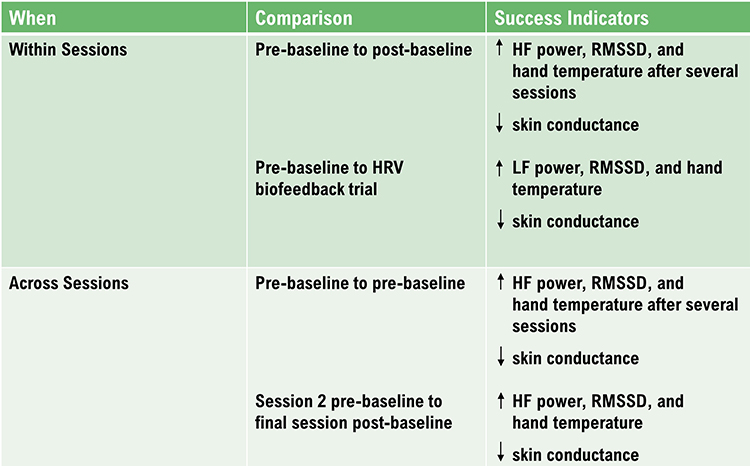
How to Select a Starting Respiration Rate
Select an initial respiration rate for an animated pacing display based on your client's RF. Since shaping is crucial to ensuring client motivation and success, choose a respiration rate within 1 or 2 breaths per minute of their baseline mean.Training Introduction
A healthy heart is not a metronome. As you inhale, your heart rate speeds, and as you exhale, your heart rate slows. This rhythmic speeding and slowing of your heart produces heart rate variability, which is vital to your health, performance, and resilience against stressors. The purpose of heart rate variability biofeedback training is to teach you to increase the healthy speeding and slowing of your heart by breathing effortlessly at the rate that is best for you and by increasing your ability to experience positive emotions like feelings of appreciation and gratitude.
Adopt a passive attitude in which you trust your body to breathe itself. Allow your attention to settle on your waist. Let your exhalation continue until your body initiates your next breath. Your inhalations should be no deeper than as if you were smelling a flower. Allow your breathing to follow the yellow ball effortlessly.
Allow your stomach to gradually plop out as you inhale and then slowly draw inward as you exhale. As you practice, we will adjust the speed of the pacing display. Let it guide your inhalation and exhalation. Allow your stomach to gradually plop out as you inhale and then slowly draw inward as you exhale. As you practice, we will adjust the speed of the pacing display.
The computer can help you learn slow, effortless breathing. The pink tracing shows your heart rate, while the violet tracing shows the movement of the sensor around your stomach. As you gradually learn low-and-slow, the two tracings should resemble smooth, repeating ocean waves.
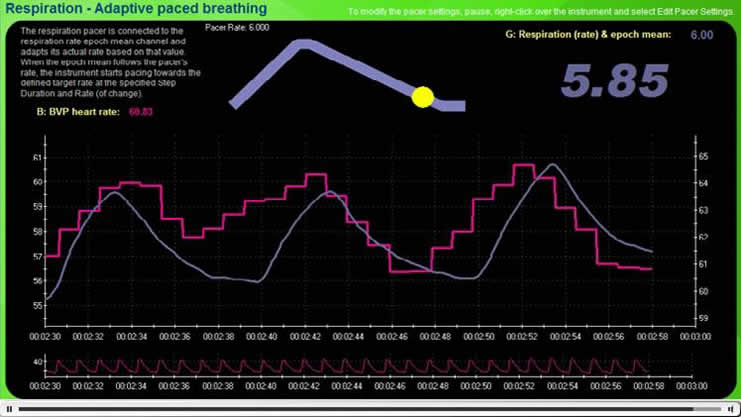
Start recording data for 3 minutes. At the end of the training segment, ask: ”How was the speed of the pacing display? Should we change it? Should we adjust the inhalation and exhalation lengths? What did you experience as you practiced breathing effortlessly?"
Training Success Indicators
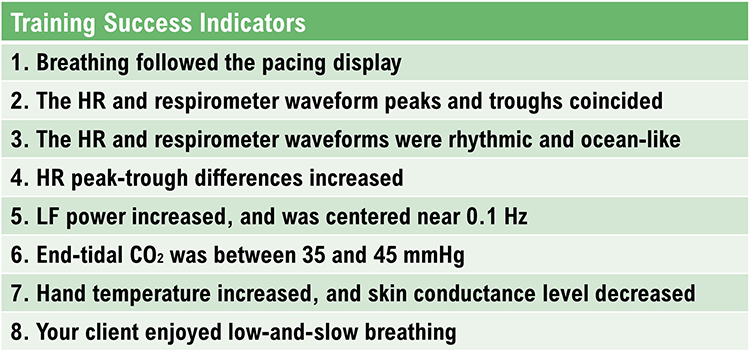
Training Difficulty Indicators
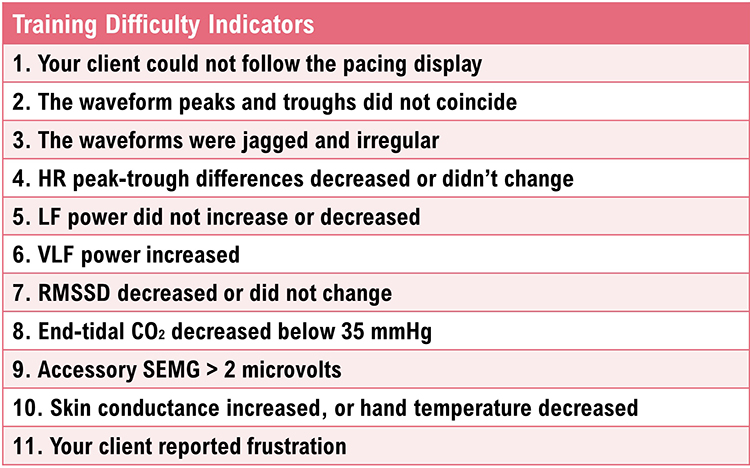
Training Segment Review
Fit an entire 3-minute segment on the screen to review it together. If your client succeeded, you might point out where they succeeded.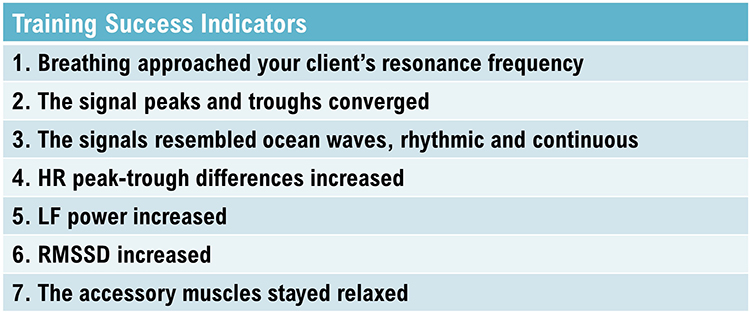
Promote Mindful Breathing
Before starting the next segment, you might ask: "What were you doing when the display became wavelike and regular? What happened when the display became more jagged and irregular?" If accessory SEMG exceeded 2 microvolts, point this out on the display, ask them if they felt the heightened breathing effort, and encourage them to "let their shoulders relax and allow themself to breathe." Reassure them that it's normal for the tracings to be choppy when people start training and that they will gradually become more wavelike as their breathing becomes more rhythmic and regular.Instead of overwhelming them with corrections, ask them to experiment with one or two changes at a time. For example, "Effortless breathing is rhythmic like ocean waves. Allow your stomach to gently expand and contract as you follow the pacing display."
Session Review
After your client has completed six 3-minute training segments, take a 3-minute post-baseline without feedback. After the post-baseline, ask your client how they felt and what they learned during the training session. Display the entire session on one screen and highlight where they succeeded and where they need more work.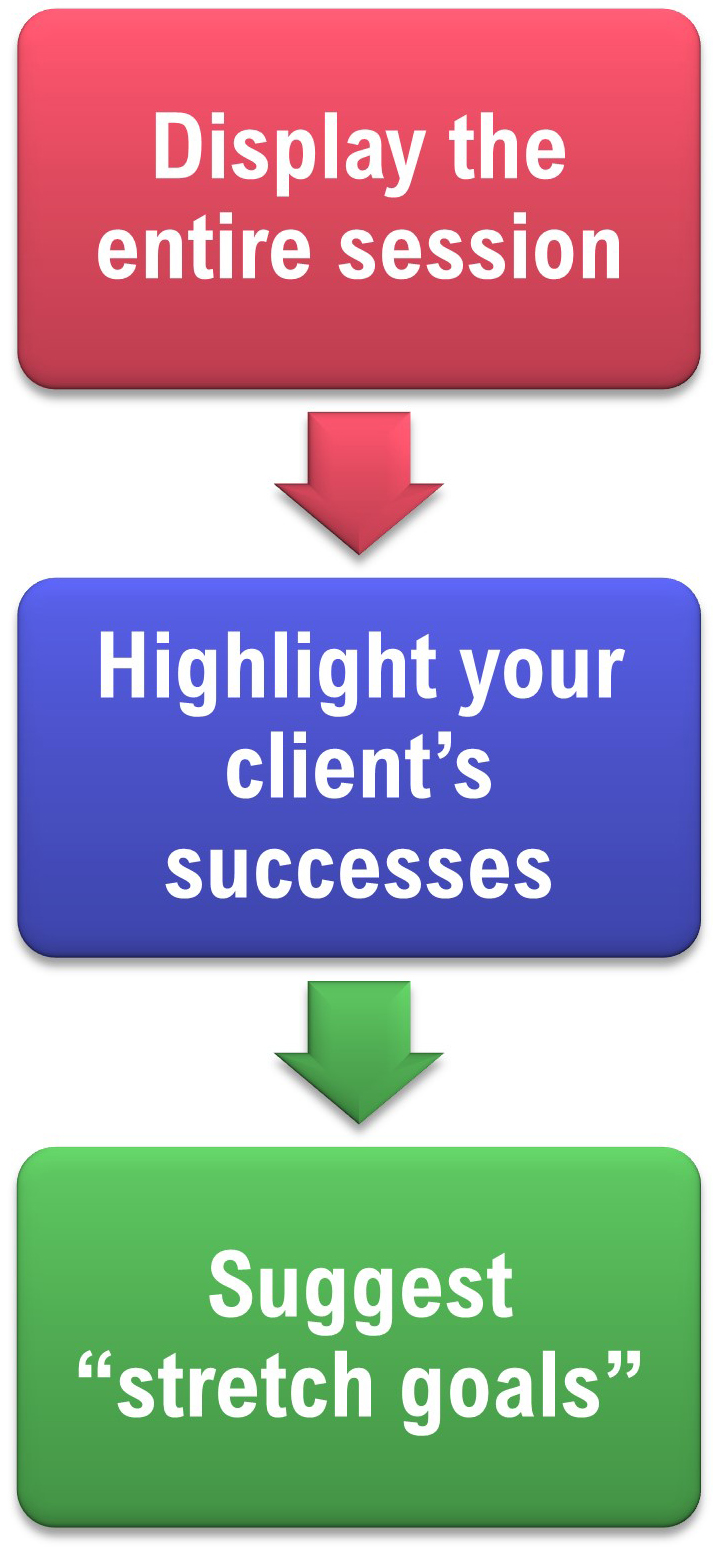
Comparing Pre- and Post-Session Values
Without pacing or feedback, your client should breathe at typical rates during the pre- and post- baselines. HF power, RMSSD, and hand temperature may increase, while the skin conductance level may decrease.The graphic below shows HF power in blue during a pre-training baseline, HRVB training, and a post-training baseline. The y-axis shows power in each band. HF power increases from ~100 during the pre-training baseline to ~300 during the post-training baseline. This change is important because increased HF power can signal greater vagal tone.
Also, note the greater LF power concentration post-training compared with pre-training during which the client breathed at typical rates. Inna Khazan generously provided the spectral plots. Inna Khazan generously provided the spectral plots.
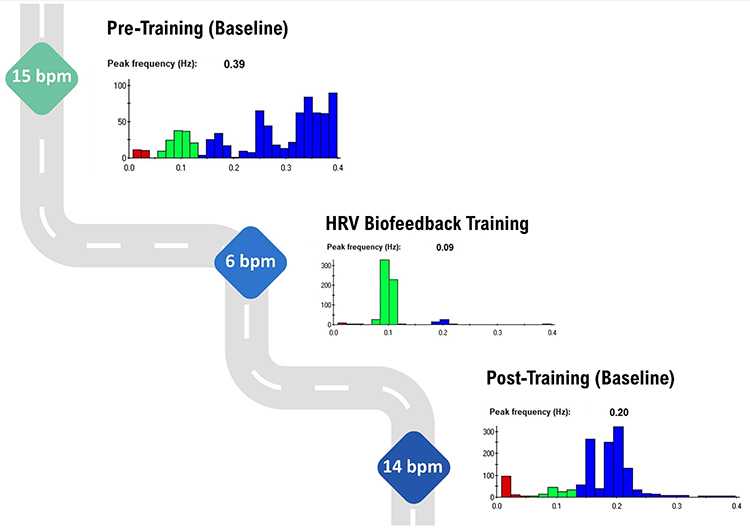
HRV Biofeedback Training Elements
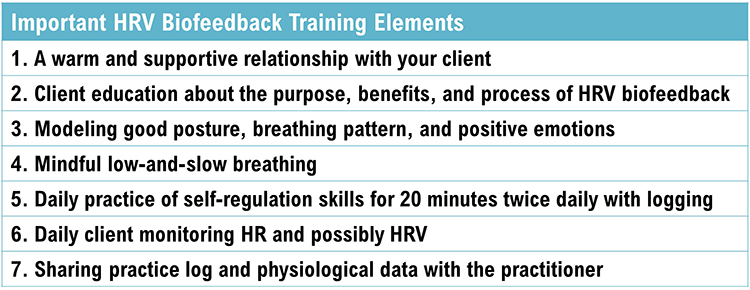
How Many HRVB Sessions Are Required?
Many clients start to breathe more effortlessly and increase HRV during their initial training session. There can be a several-week lag between increased HRV and improved health or performance. Clients require this time to consolidate their learning and transfer enhanced skills to the diverse settings of their lives.Practice is the bridge between the clinic and everyday life.

Increased RSA immediately “exercises” the baroreflex without changing vagal tone or tightening blood pressure regulation. Those changes require months of practice (Gevirtz, Lehrer, & Schwartz, 2016; Lagos et al., 2011).
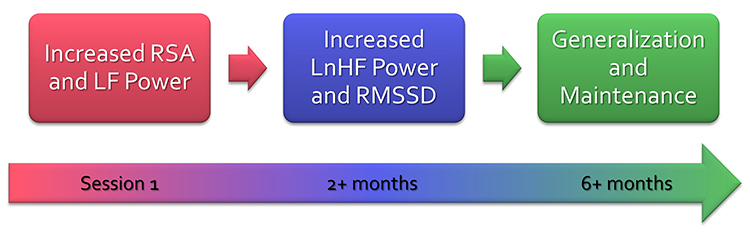
Practice Assignments
Clients can measure their HRV while breathing at typical rates when they wake up. They can send a weekly report to you to show trends in HRV. Several consumer-grade products automate sharing client data. Graphic © Elite Academy.
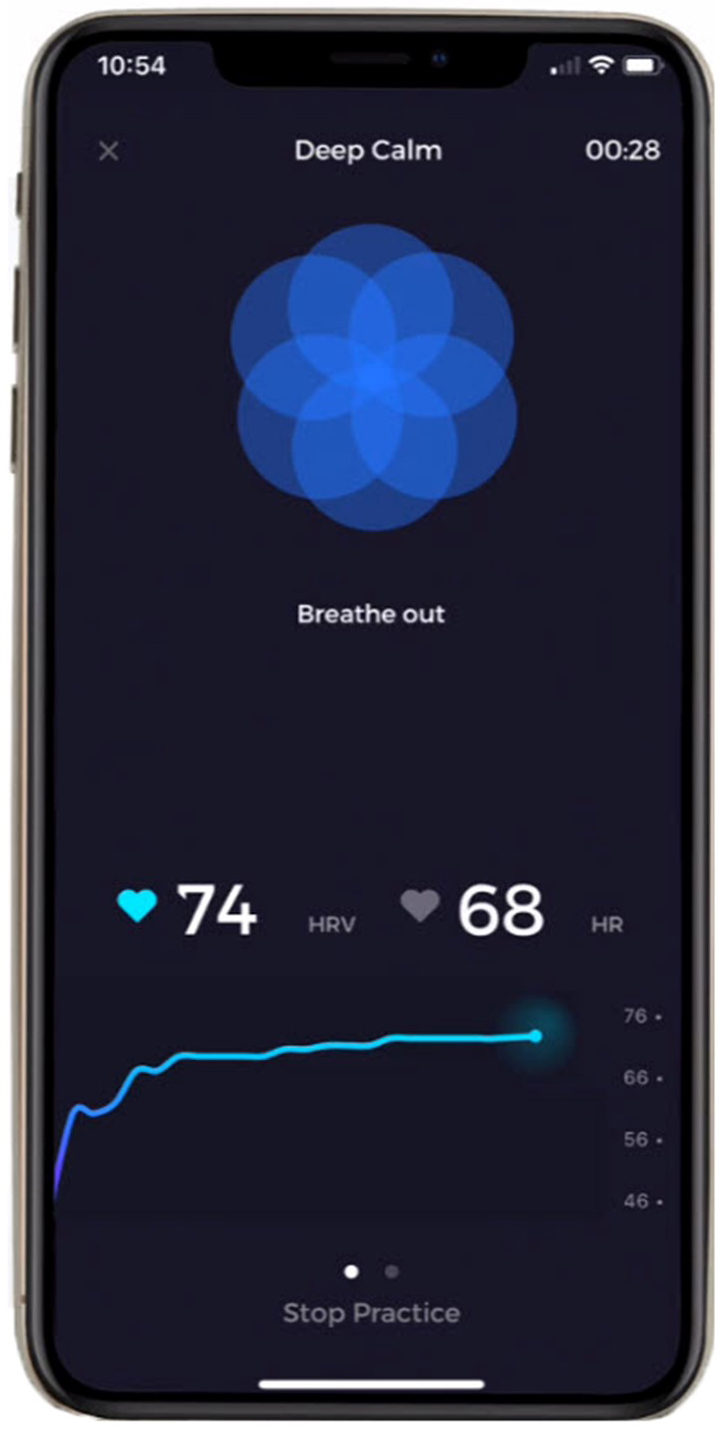
Assign 20 minutes of practice twice a day with HRV monitoring. They can fill out a diary online after each practice session and send you their IBIs. Khazan (2013) provides an excellent selection of logs in The Clinical Handbook of Biofeedback that you can adapt.
How much will your clients actually practice? You may have to settle for 10 minutes once a day or
“as needed.” Lehrer et al. (2020a) concluded that the frequency of home practice length did not impact effect size. The practice of resonance frequency breathing as needed may have produced most of their gains (p. 125).
As recommended by Gevirtz, include starting and ending hand temperatures since successful HRVB practice may produce hand-warming.
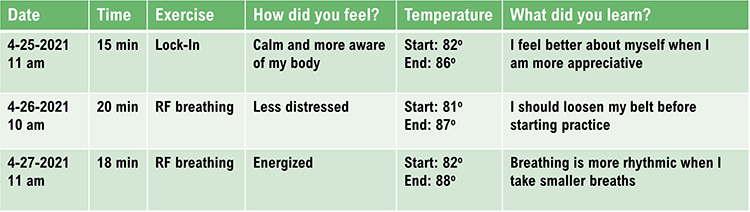
Explain the purpose of the exercise, demonstrate the skill in the clinic, and confirm that they can correctly perform it and agrees to practice it. To build a collaborative relationship and empower your client, encourage them to find ways to improve the exercise or develop a different one.
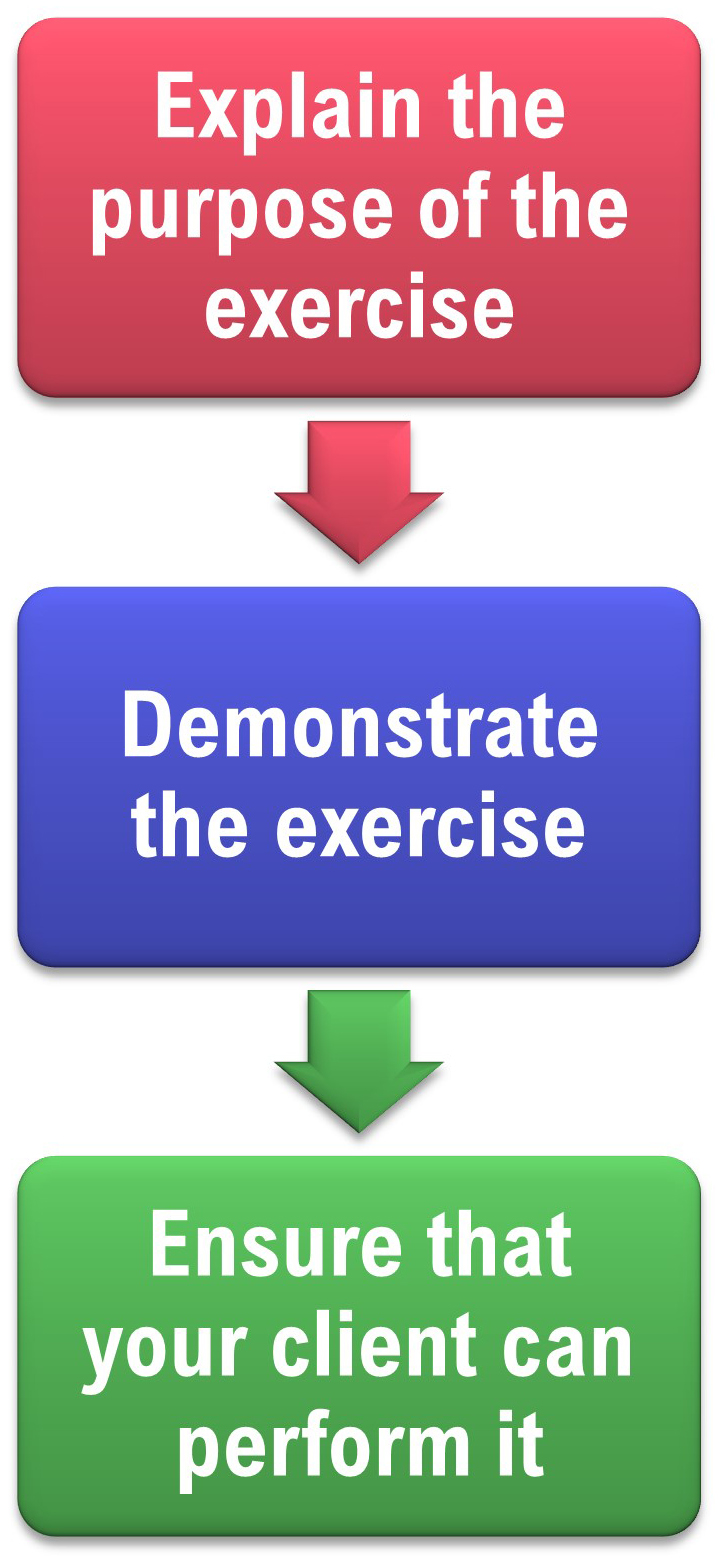
Overview
This section addresses practice in diverse settings, aerobic activity, monitor HR, monitor HRV, emotional self-regulation, home HRV practice, advanced HRV assessment, and monitor finger temperature.Practice in Diverse Settings
Encourage clients to practice RF breathing during everyday activities in diverse settings (commuting, work, and home). Graphic © fizkes/Shutterstock.com.
Aerobic Activity
Assign 20 minutes a day of aerobic activity, especially if your client is sedentary. Aerobic exercise lowers HR and raises HRV. Graphic © Jacob Lund/Shutterstock.com.
Monitor HR
Invite clients to monitor their HR during daily activities and emotional states to increase mindfulness of stressors and their physiological responses to these challenges.
Monitor HRV
Apps allow you to take HRV snapshots with limited artifact correction.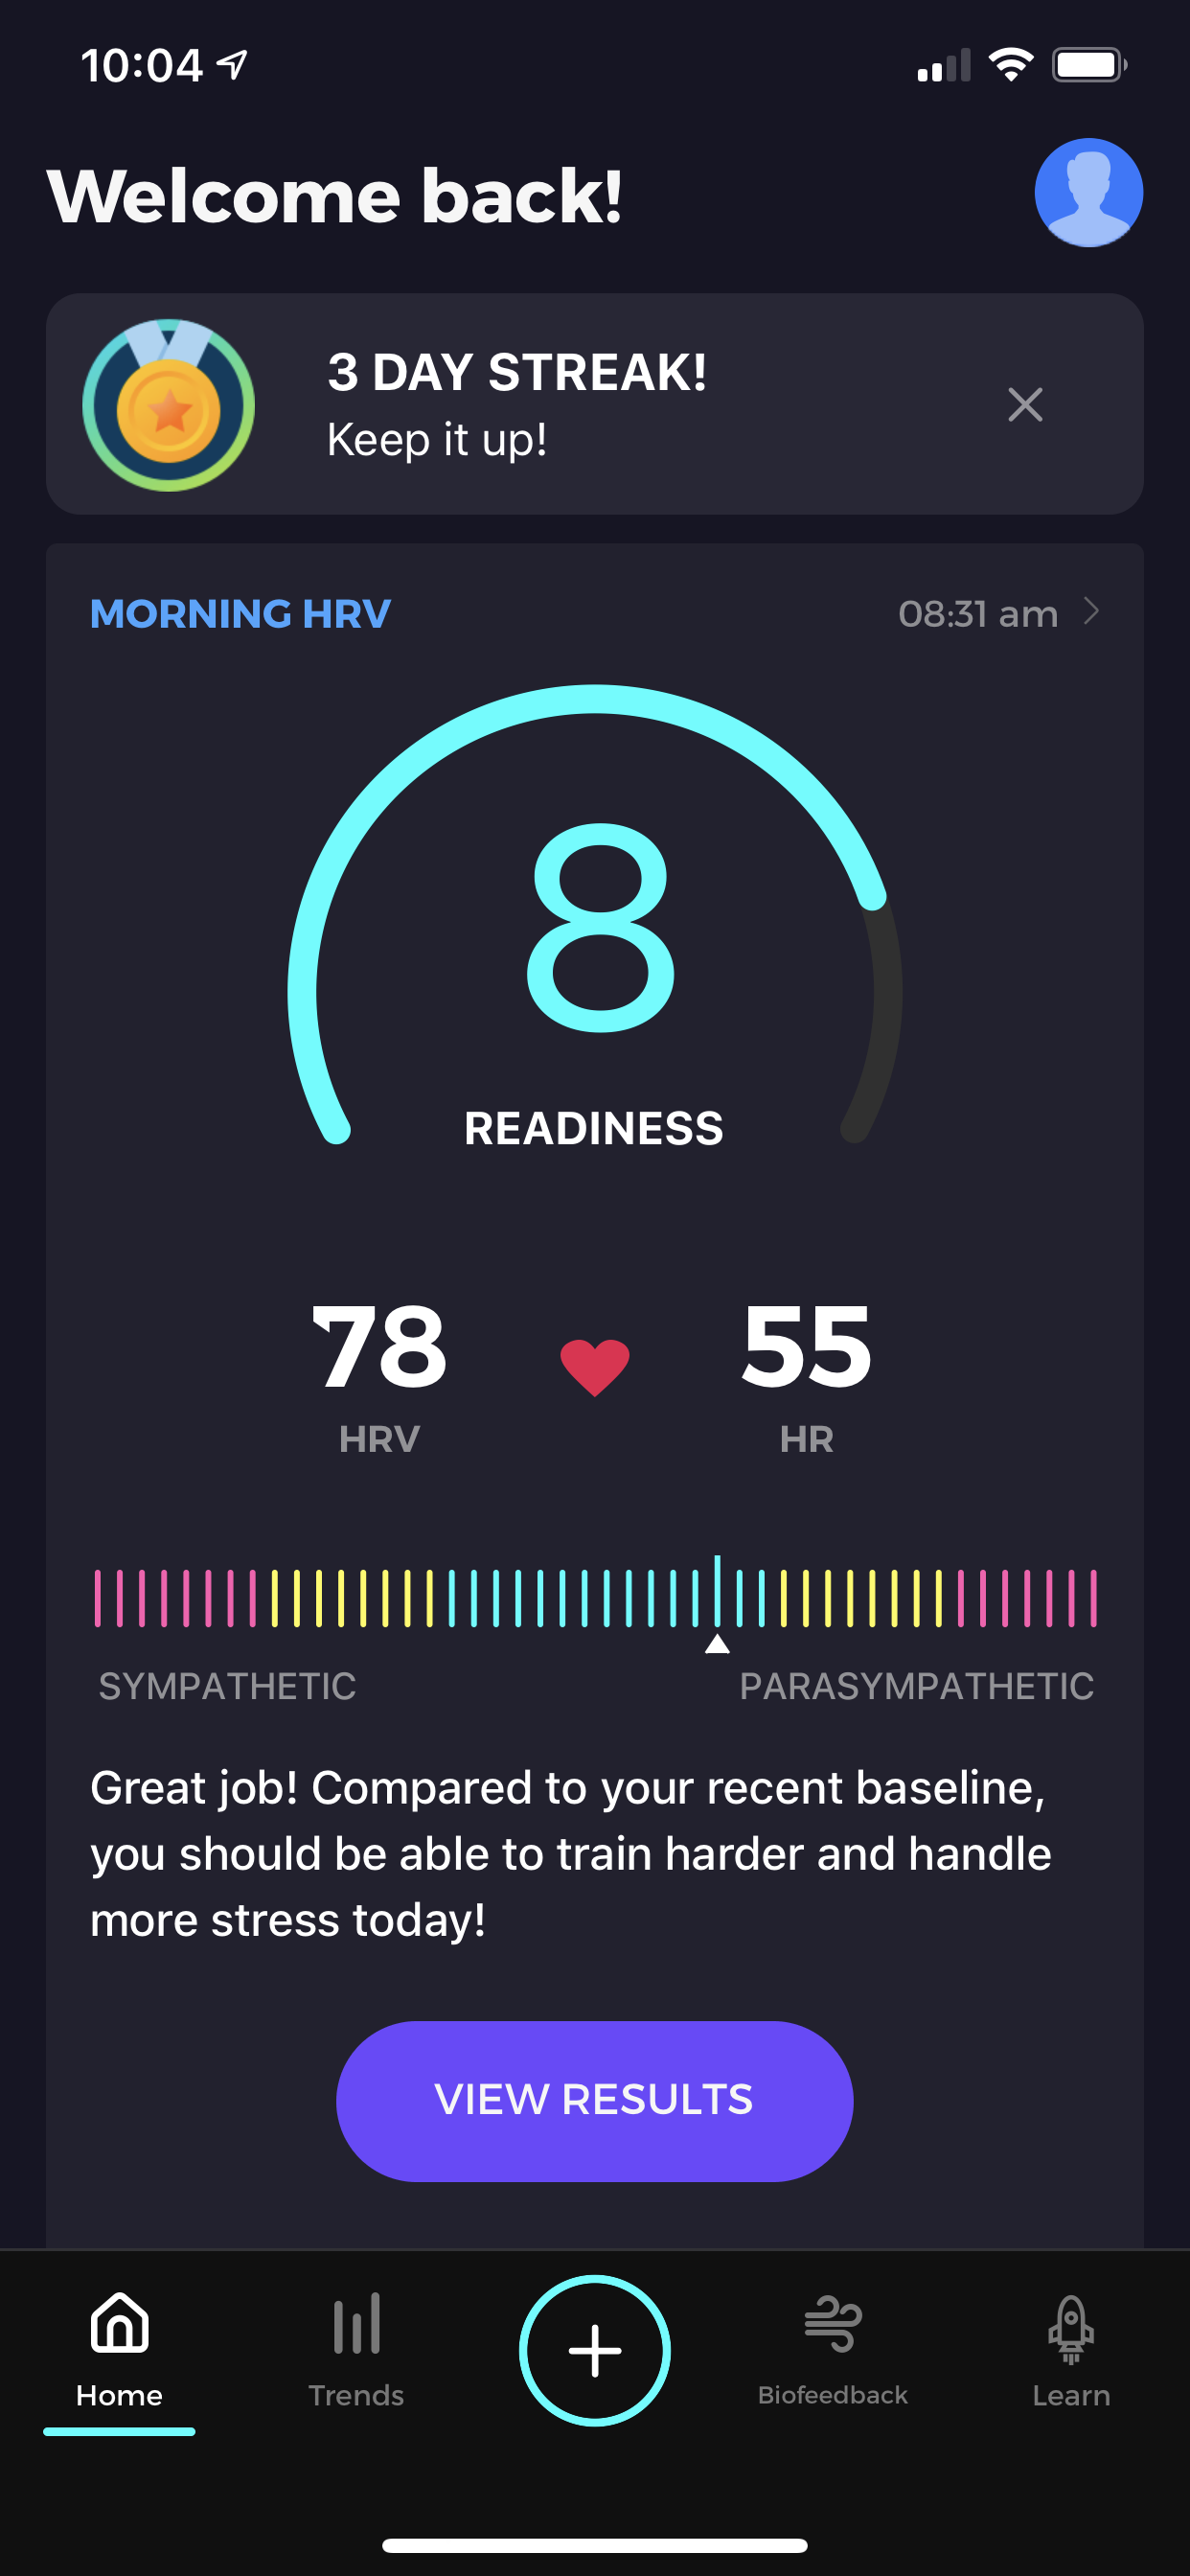 |
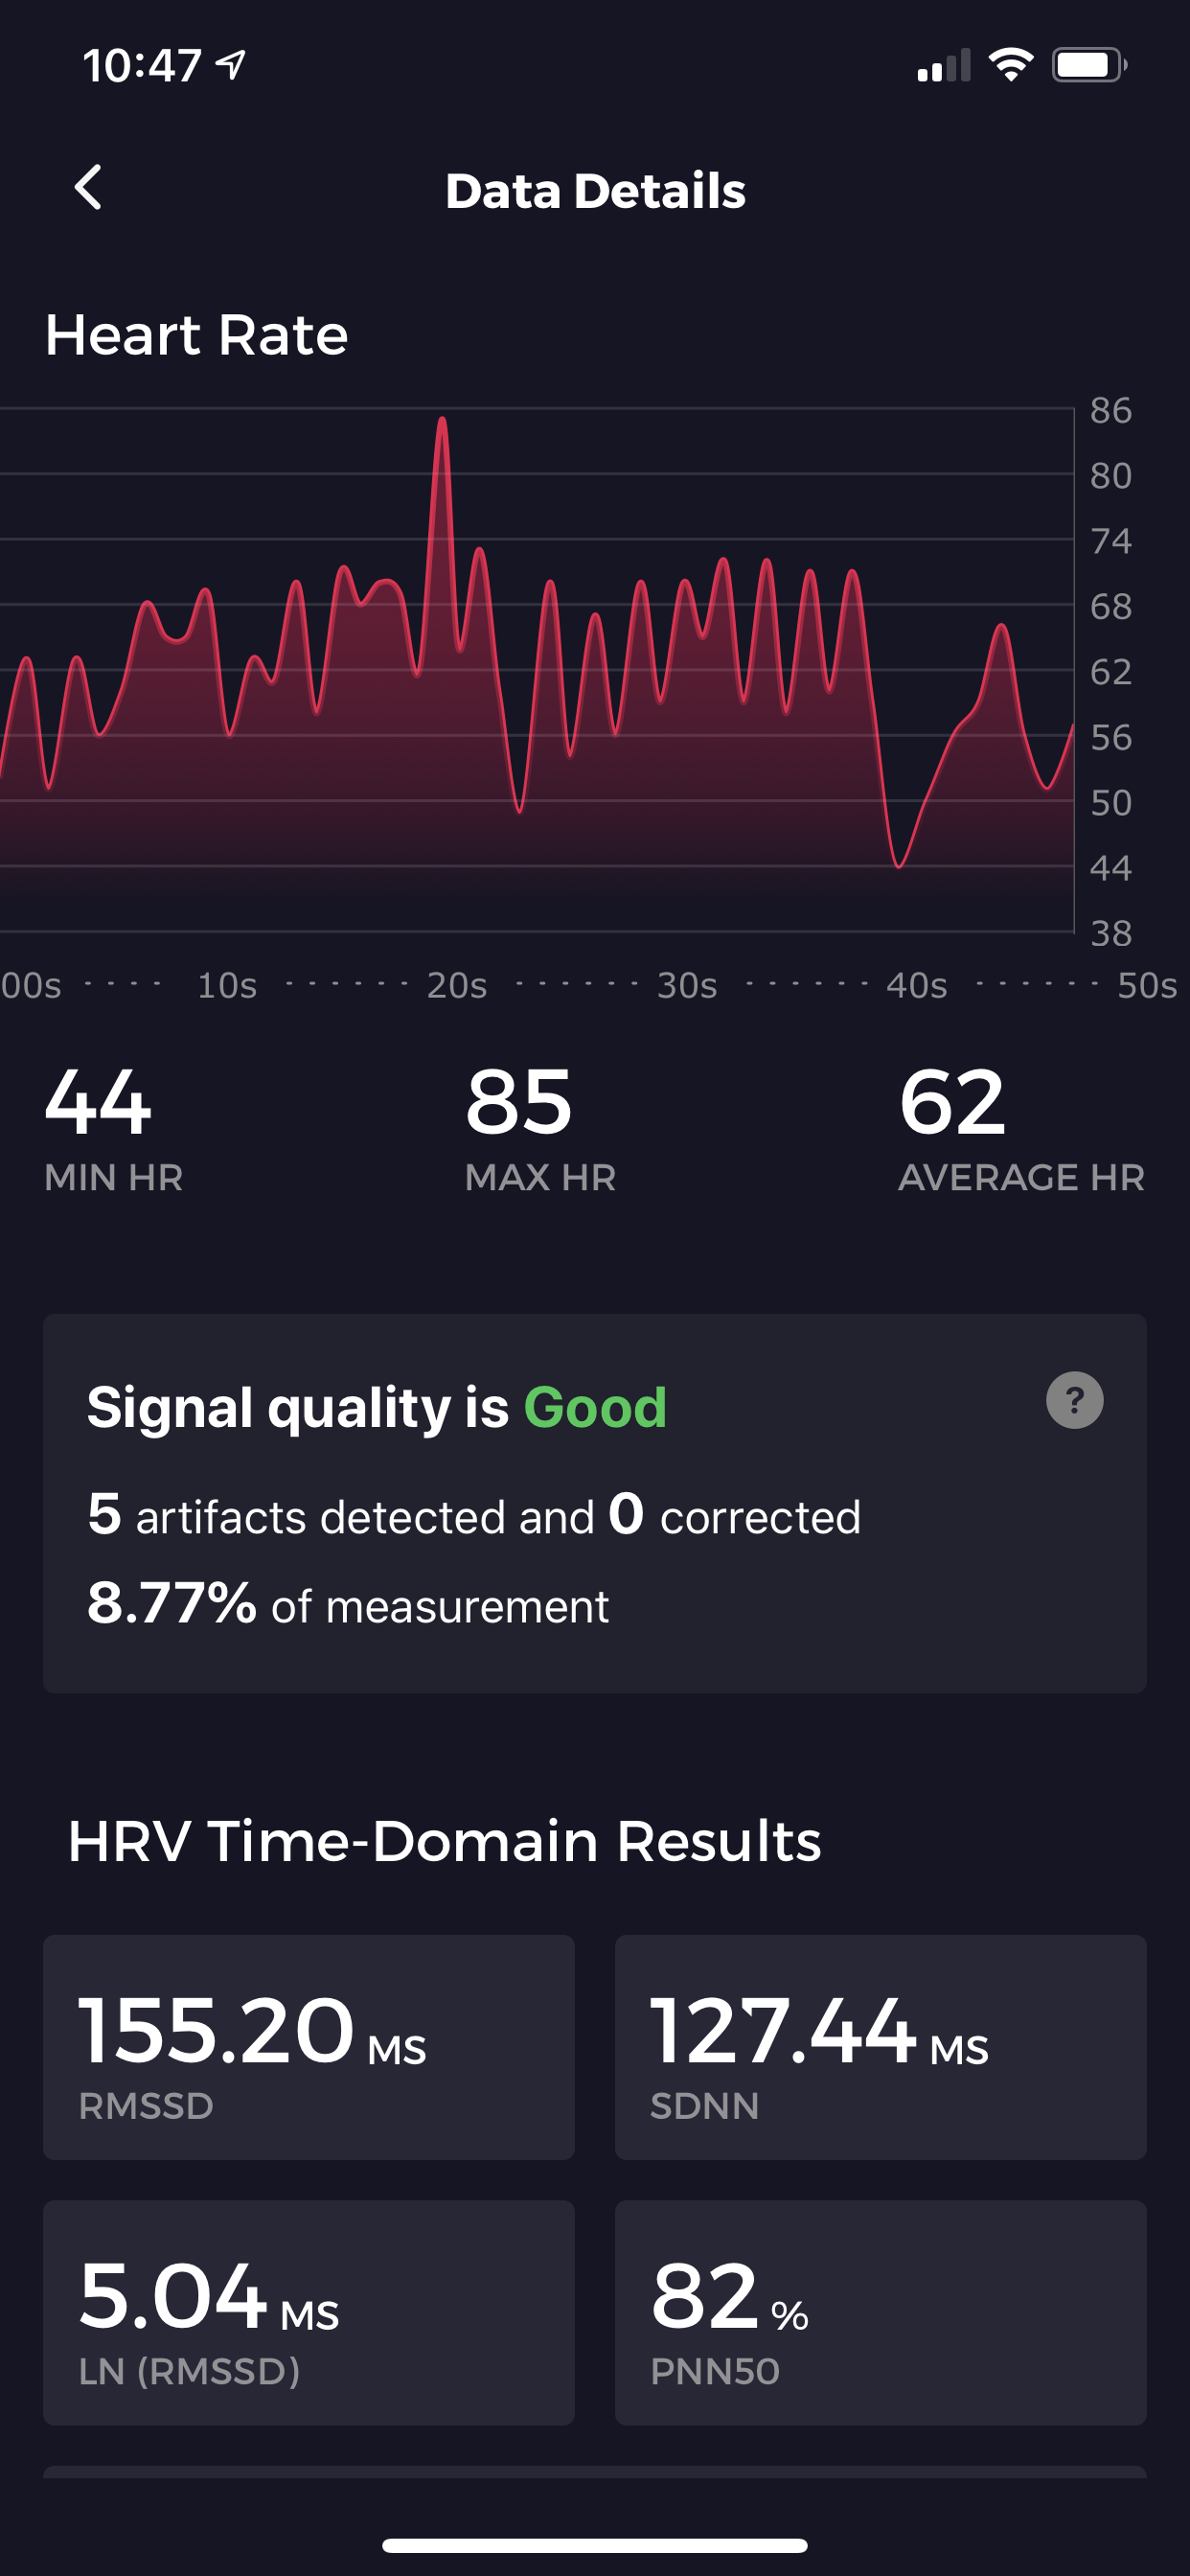 |
Emotional Self-Regulation
Emotional self-regulation practice may reduce parasympathetic withdrawal, cultivate the tend-and-befriend response, and increase resilience. Graphic © Rido/Shutterstock.com.
Institute of HeartMath Lock-In ® Technique Instructions:
Try to focus your attention on the area around your heart. Maintain your heart focus and, while breathing, imagine that your breath is flowing in and out through the heart area. Breathe casually, just a little deeper than normal.”
Now try to recall a positive emotion or feeling that makes you relaxed and comfortable. Find a positive feeling like appreciation, care, joy, kindness, or compassion. You can recall a time you felt appreciation or care. This could be the appreciation or care you feel towards a special person, a pet, a place you enjoy, or an activity that was fun for you.
If you can’t feel anything, it’s ok. Just try to find a sincere attitude of appreciation or care. Continue to think of this positive feeling or emotion.
Acceptance and Commitment Therapy (ACT) and compassion meditation may also aid emotional self-regulation.

Home HRV Practice
Portable HRV biofeedback devices allow personal training whenever your clients want.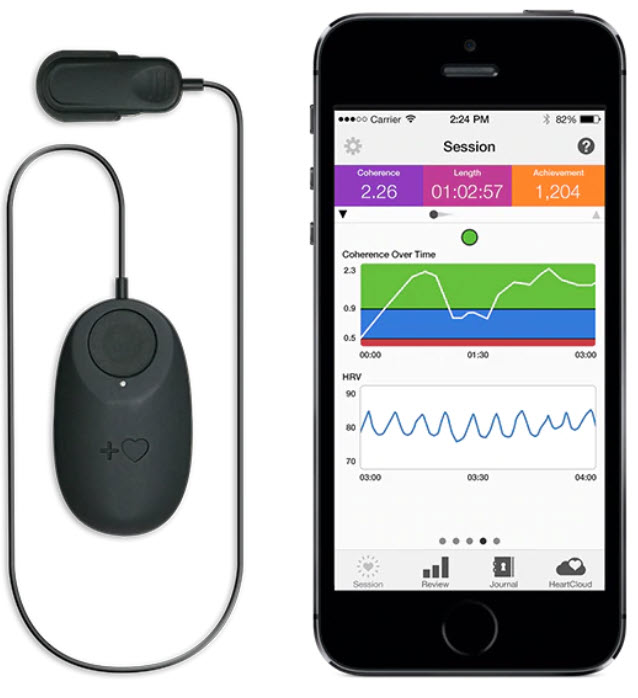
Monitor Finger Temperature
Encourage your clients to monitor their hand temperature using inexpensive alcohol thermometers to see whether their practice resulted in warming or cooling.
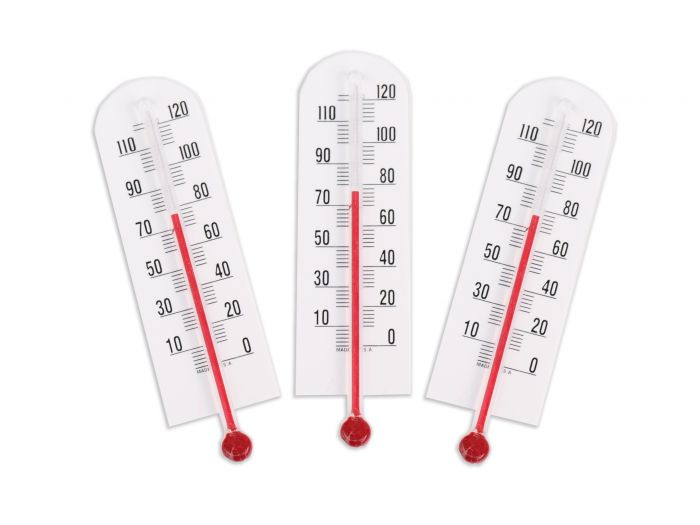
HRV MYTHS
Dr. Inna Khazan discusses HRV Myths © Association for Applied Psychophysiology and Biofeedback. You can enlarge the video by clicking on the bracket icon at the bottom right of the screen. When finished, click on the ESC key.
Glossary
accessory muscles: the sternocleidomastoid, pectoralis minor, scalene, and trapezius muscles, which are used during forceful breathing, as well as clavicular and thoracic breathing.
apnea: breath suspension.
baroreceptor reflex (baroreflex): a mechanism that provides negative feedback control of BP. Elevated BP activates the baroreflex to lower BP, and low BP suppresses the baroreflex to raise blood pressure.
capnometer: an instrument that monitors the carbon dioxide (CO2) concentration in an air sample (end-tidal CO2) by measuring the absorption of infrared light.
clavicular breathing: a breathing pattern that primarily relies on the external intercostals and the accessory muscles to inflate the lungs, resulting in a more rapid respiration rate, excessive energy consumption, and incomplete ventilation of the lungs.
coherence: a narrow peak in the BVP and ECG power spectrum between 0.09 and 0.14 Hz.
diaphragm: the dome-shaped muscle whose contraction enlarges the vertical diameter of the chest cavity and accounts for about 75% of air movement into the lungs during relaxed breathing.
end-tidal CO2: the percentage of CO2 in exhaled air at the end of exhalation.
frequency-domain measures of HRV: the calculation of the absolute or relative power of the HRV signal within four frequency bands.
high-frequency (HF) band: the HRV frequency range from 0.15-.40 Hz that represents the inhibition and activation of the vagus nerve by breathing (respiratory sinus arrhythmia).
interbeat interval (IBI): the time interval between the peaks of successive R-spikes (initial upward deflections in the QRS complex). This is also called the NN (normal-to-normal) interval after the removal of artifacts.
low-frequency (LF) band: the HRV frequency range of 0.04-0.15 Hz that may represent the influence of PNS and baroreflex activity when breathing at the RF.
metabolic acidosis: a pH imbalance in which the body has accumulated excessive acid and has insufficient bicarbonate to neutralize its effects. In diabetes and kidney disease, hyperventilation is an attempt to compensate for abnormal acid-base balance, and slower breathing could endanger health.
mindfulness: a nonjudgmental focus of attention on the present on a moment-to-moment basis.
pulse oximeter: a device that measures dissolved oxygen in the bloodstream using a photoplethysmograph sensor placed against a finger or earlobe.
resilience: the process of adapting effectively to stressors, threats, and trauma.
resonance frequency: the frequency at which a system, like the cardiovascular system, can be activated or stimulated.
reverse breathing: the abdomen expands during exhalation and contracts during inhalation, often resulting in incomplete ventilation of the lungs.
rhythmical skeletal muscle tension (RSMT): the simultaneous contraction of the hands and feet near an individual's RF to increase RSA.
synchrony: the phase relationship between two signals in which their peaks and valleys are aligned (e.g., HR and respirometer expansion reach their maximum and minimum values simultaneously).
thoracic breathing: a breathing pattern that primarily relies on the external intercostals to inflate the lungs, resulting in a more rapid respiration rate, excessive energy consumption, and incomplete ventilation of the lungs.
time-domain measures of HRV: indices like SDNN that measure the degree to which the IBIs between successive heartbeats vary.
torr: the unit of atmospheric pressure, named after Torricelli, which equals 1 millimeter of mercury (mmHg) and is used to measure end-tidal CO2.
trapezius-scalene placement: active SEMG electrodes are located on the upper trapezius and scalene muscles to measure respiratory effort.
ultra-low-frequency (ULF) band: the HRV frequency range below 0.003 Hz. Very slow biological processes that include circadian rhythms, core body temperature, metabolism, the renin-angiotensin system, and possible PNS and SNS contributions.
very-low-frequency (VLF): the HRV frequency range of 0.003-0.04 Hz that may represent temperature regulation, plasma renin fluctuations, endothelial and physical activity influences, and possible intrinsic cardiac, PNS, and SNS contributions.
REVIEW FLASHCARDS ON QUIZLET
Click on the Quizlet logo to review our chapter flashcards.
Assignment
Which of the two screens below shows better HRV performance? What is the basis for your judgment?
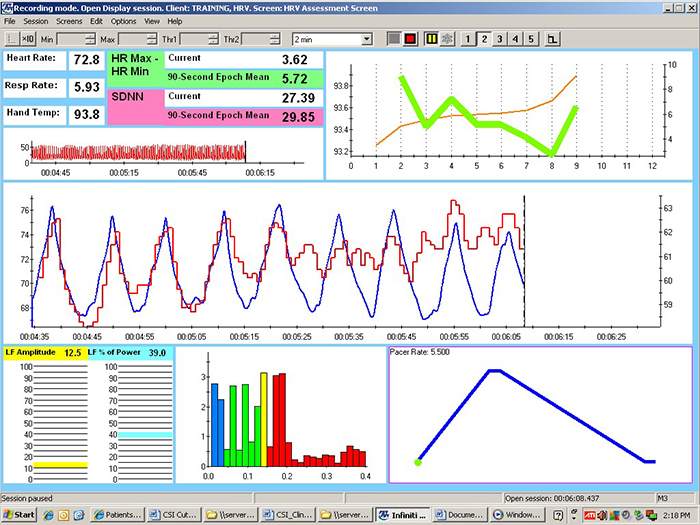
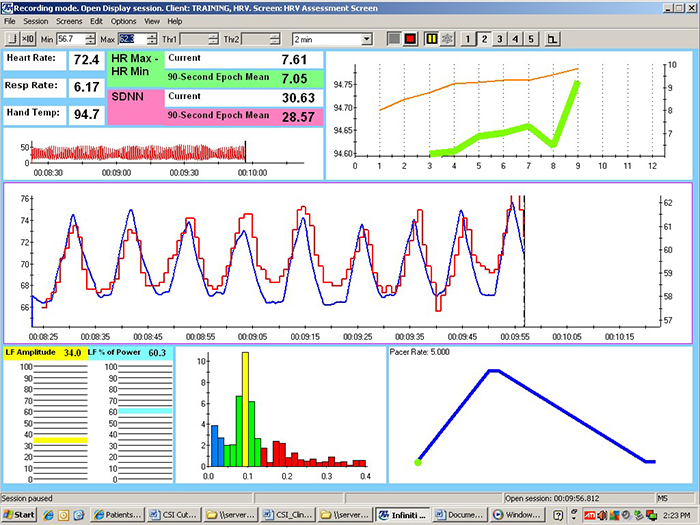
Check the mean respiration rates to confirm that this client breathed around 6 breaths per minute in each session. She did. Examine the values for HR Max - HR Min and LF amplitude. Both were higher in the second session. The greater HR Max - HR Min was also visually evident in the peak-to-trough differences, which were larger in the second session. Look at the distribution of signal power at 0.1 Hz. Signal energy was concentrated at and around this dominant frequency in the second session. Inspect the synchrony of the HR and respirometer tracings. The peaks and valleys of these tracing were more closely aligned in the second session. Finally, compare hand temperatures. Her hands were almost 1 degree F warmer in the second session.
These recordings were from a chronic pain patient who received treatment in an interdisciplinary chronic pain program.
References
Bax, A., Robinson, T., & Goedde, J. (2007). The Cousins relaxation exercise increases heart rate variability [Abstract]. Applied Psychophysiology and Biofeedback, 32(1), 52.
Bridges, L. J., Denham, S. A., & Ganiban, J. M. (2004). Definitional issues in emotion regulation research. Child Development, 75(2), 340-345. https://doi.org/10.1111/j.1467-8624.2004.00675.x
Carter, R., Cheuvront, S. N., Wray, D. W., Kolka, M. A., Stephenson, L. A., & Sawka, M. N. (2005). The influence of hydration status on heart rate variability after exercise heat stress. Journal of Thermal Biology, 30(7), 495-502. https://doi.org/10.1016/j.jtherbio.2005.05.006
Constant, I., Laude, D., Murat, I., & Elhhozi, J.-L. (1999). Pulse rate variability is not a surrogate for heart rate variability. Clinical Science, 97(4), 391–397. PMID: 10491338
Gevirtz, R. N., Lehrer, P. M., & Schwartz, M. S. (2016). Cardiorespiratory biofeedback. In M.S. Schwartz & F. Andrasik (Eds.). Biofeedback: A practitioner’s guide (4th ed.). The Guilford Press.
Gilbert, C. (2012). Pulse oximetry and breathing training. Biofeedback, 40(4), 137-141. https://doi.org/10.5298/1081-5937-40.4.04
Ginsberg, J. P., Berry, M. E., & Powell, D. A. (2010). Cardiac coherence and posttraumatic stress disorder in combat veterans. Alternative Therapies, 16(4), 52-60.
Grant, J., Wally, C., & Truitt, A. (2010). The effects of Kargyraa throat-singing and singing a fundamental note on heart rate variability [Abstract]. Poster presented at the meeting of the Biofeedback Foundation of Europe, Rome, Italy.
Grossman. P., & Kollai, M. (1993). Respiratory sinus arrhythmia, cardiac vagal tone, and respiration: Within- and between-individual relations. Psychophysiology, 30, 486-495. https://doi.org/10.1111/j.1469-8986.1993.tb02072.x
Hemon, M. C., & Phillips, J. P. (2016). Comparison of foot finding methods for deriving instantaneous pulse rates from photoplethysmographic signals. Journal of Clinical Monitoring and Computing, 30(2), 157–168. https://doi.org/10.1007/s10877-015-9695-6.
Jan, H.-Y., Chen, M.-F., Fu, T.-C., Lin, W.-C., Tsai, C.-L., & Lin, K.-P. (2019). Evaluation of coherence between ECG and PPG derived parameters on heart rate variability and respiration in healthy volunteers with/without controlled breathing. Journal of Medical and Biological Engineering, 39, 783-795. https://doi.org/10.1007/s40846-019-00468-9
Kabat-Zinn, J. (1994). Wherever you go, there you are: Mindfulness mediation in everyday life. Hyperion Books.
Lagos, L., Vaschillo, E., Vaschillo, B., Lehrer, P., Bates, M., & Pandina, R. (2011). Virtual reality assisted heart rate variability biofeedback as a strategy to improve golf performance: A case study. Biofeedback, 39(1), 15-20. https://doi.org/10.5298/1081-5937-39.1.11
Lehrer, P. M. (2007). Biofeedback training to increase heart rate variability. In P. M. Lehrer, R. M. Woolfolk, & W. E. Sime (Eds.). Principles and practice of stress management (3rd ed.). The Guilford Press.
Lehrer, P. M. (2013). How does heart rate variability biofeedback work? Resonance, the baroreflex, and other mechanisms. Biofeedback, 41, 26–31. https://doi.org/10.5298/1081-5937-41.1.02
Lehrer, P. M., & Gevirtz, R. (2014). Heart rate variability: How and why does it work? Frontiers in Psychology. https://doi.org/10.3389/fpsyg.2014.00756
Lehrer, P., Vaschillo, B., Zucker, T., Graves, J., Katsamanis, M., Aviles, M., & Wamboldt, F. (2013). Protocol for heart rate variability biofeedback training. Biofeedback, 41(3), 98-109.
Lehrer, P. M., Vaschillo, E., & Vaschillo, B. (2000). Resonant frequency biofeedback training to increase cardiac variability: Rationale and manual for training. Applied Psychophysiology and Biofeedback, 25(3), 177-191. https://doi.org/10.1023/a:1009554825745
McCraty, R. (2013). Personal communication regarding the benefits of heartfelt emotion.
McCraty, R., Atkinson, M., Tiller, W. A. (1995). The effects of emotion on short term heart rate variability using power spectrum analysis. American Journal of Cardiology, 76. https://doi.org/10.1016/s0002-9149(99)80309-9
McCraty, R., Atkinson, M., Tomasino, D, & Bradley, R. T. (2006). The coherent heart. Institute of HeartMath.
McCraty, R., Atkinson M, Tomasino, D., & Bradley, R. T. (2009). The coherent heart: Heart-brain interactions, psychophysiological coherence, and the emergence of system-wide order. Integral Review, 5(2), 10-115.
Medeiros, R. F., Silva, B. M., Neves, F. J., Rocha, N. G., Sales, A. R. K., & Nobrega, A. C. (2011). Impaired hemodynamic response to mental stress in subjects with prehypertension is improved after a single bout of maximal dynamic exercise. Clinics, 66(9), 1523–1529. https://doi.org/10.1590/S1807-59322011000900003.
de Oliveira, R., Araújo, L. F., de Figueiredo, R. C., Goulart, A. C., Schmidt, M. I., Barreto, S. M., & Ribeiro, A. (2017). Coffee consumption and heart rate variability: The Brazilian Longitudinal Study of Adult Health (ELSA-Brasil) Cohort Study. Nutrients, 9(7), 741. https://doi.org/10.3390/nu9070741
Shaffer, F., Bergman, S., & Dougherty, J. (1998). End-tidal CO2 is the best Indicator of breathing effort [Abstract]. Applied Psychophysiology and Biofeedback, 23(2).
Shaffer, F., Bergman, S., & White, K. (1997). Indicators of diaphragmatic breathing effort [Abstract]. Applied Psychophysiology and Biofeedback, 22(2), 145.
Shaffer, F., Greve, E., & Reinagel, K. (1996). Predictors of inhalation volume [Abstract]. Biofeedback and Self-Regulation, 21(4), 352.
Shaffer, F., Mayhew, J., Bergman, S., Dougherty, J., & Irwin, D. (1999). Designer jeans increase breathing effort [Abstract]. Applied Psychophysiology and Biofeedback, 24(2), 124-125.
Shaffer, F., & Moss, D. (2006). Biofeedback. In Y. Chun-Su, E. J. Bieber, & B. Bauer (Eds.). Textbook of complementary and alternative medicine (2nd ed.). Informa Healthcare.
Shaffer, F., McCraty, R., & Zerr, C. L. (2014). A healthy heart is not a metronome: An integrative review of the heart’s anatomy and heart rate variability. Frontiers in Psychology. doi:10.3389/fpsyg.2014.01040
Taub, E., & School, P. J. (1978). Some methodological considerations in thermal biofeedback training. Behavior Research Methods & Instrumentation, 10(5), 617-622. https://doi.org/10.3758/BF03205359
Vansickle, J., Putnam, R., Harris, M., Garcia, M., Bell, B., Nelson, M., & Lowery, L. (2020). Caffeine intake does not negatively affect heart rate variability in physically active university students: Preliminary findings. Current Development in Nutrition, 4(Supplement 2), 1770. https://doi.org/10.1093/cdn/nzaa066_025
Vaschillo, E., Lehrer, P., Rishe, N., & Konstantinov, M. (2002). Heart rate variability biofeedback as a method for assessing baroreflex function: A preliminary study of resonance in the cardiovascular system. Applied Psychophysiology and Biofeedback, 27, 1-27. https://doi.org/10.1023/a:1014587304314
Vaschillo, E. G., Vaschillo, B., Pandina, R. J., & Bates, M. E. (2011). Resonances in the cardiovascular system caused by rhythmical muscle tension. Psychophysiology, 48, 927–936. https://doi.org/10.1111/j.1469-8986.2010.01156.x
Wally, C., Korenfeld, I., Brooks, K., Carrell, D., Lau, D., Peterson, J., Schafer, M., Truitt, A., Fuller, J., Westermann-Long, A., & Korenfeld, D. (2011). Chanting “Om” increases heart rate variability by slowing respiration [Abstract]. Applied Psychophysiology and Biofeedback, 36, 223.
Watso, J. C., & Farquhar, W. B. (2019). Hydration status and cardiovascular function. Nutrients, 11(8), 1866. https://doi.org/10.3390/nu11081866
Zerr, C., Kane, A., Vodopest, T., Allen, J., Fluty, E., Gregory, J., DeBold, M., Schultz, D., Robinson, G., Golan, R., Hannan, J., Bowers, S., Cangelosi, A., Korenfeld, D., Jones, D., Shepherd, S., Burklund, Z., Spaulding, K., Hoffman, W., & Shaffer, F. (2014). HRV biofeedback training raises temperature and lowers skin conductance. Applied Psychophysiology and Biofeedback, 39(3), 299. https://doi.org/10.1007/s10484-014-92549
Zerr, C., Kane, A., Vodopest, T., Allen, J., Hannan, J., Fabbri, M., Williams, C., Cangelosi, A., Owen, D., Cary, B., & Shaffer, F. (2015). Does inhalation-to-exhalation ratio matter in heart rate variability biofeedback? Applied Psychophysiology and Biofeedback, 40(2), 135. https://doi.org/10.1007/s10484-015-9282-0
Test Yourself
Click on the ClassMarker logo to take 10-question tests over this unit without an exam password.